noncler

2.8K posts

noncler banner
noncler

noncler

@nonclerr

hope this page will help u my telegram for cooperation: abclogic

join my tg → Katılım Kasım 2022
24 Takip Edilen1.2K Takipçiler
noncler
noncler@nonclerr·
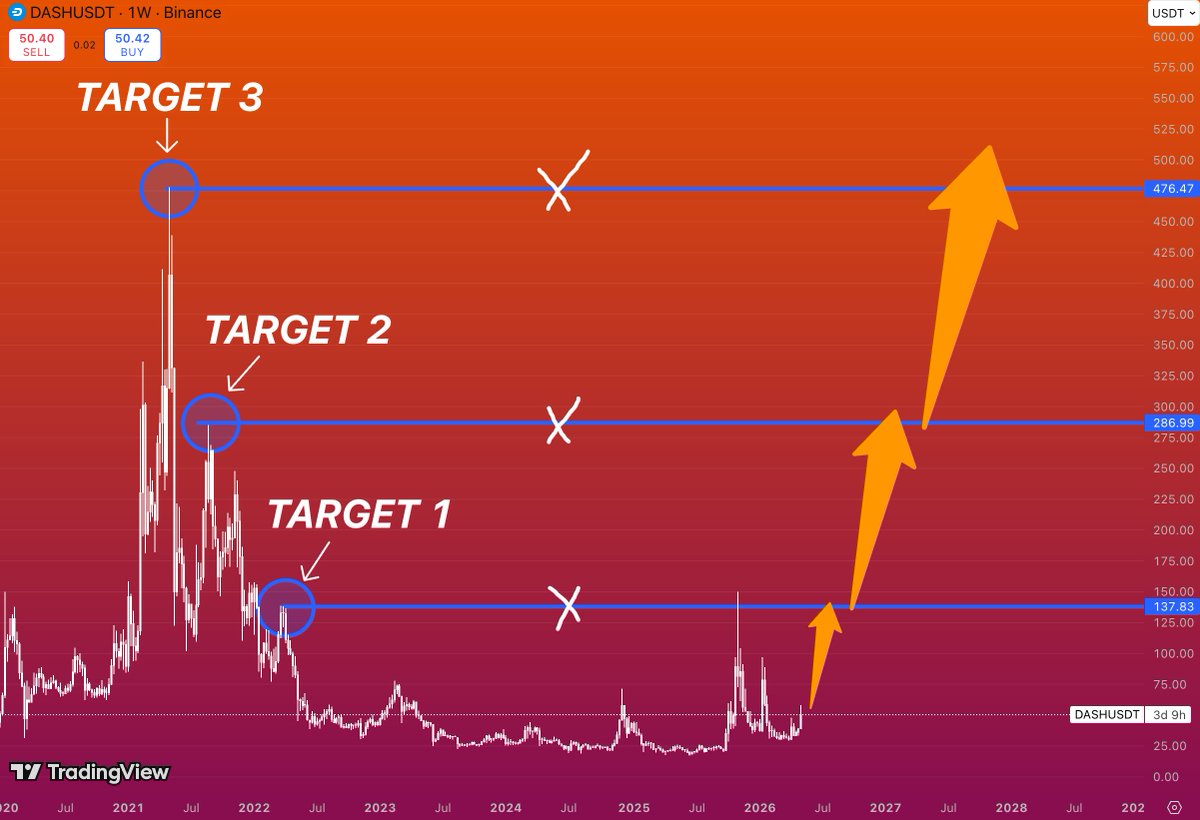
People forgot $DASH even exists And honestly… that’s usually how old cycle winners start setting up again The chart spent years doing absolutely nothing 
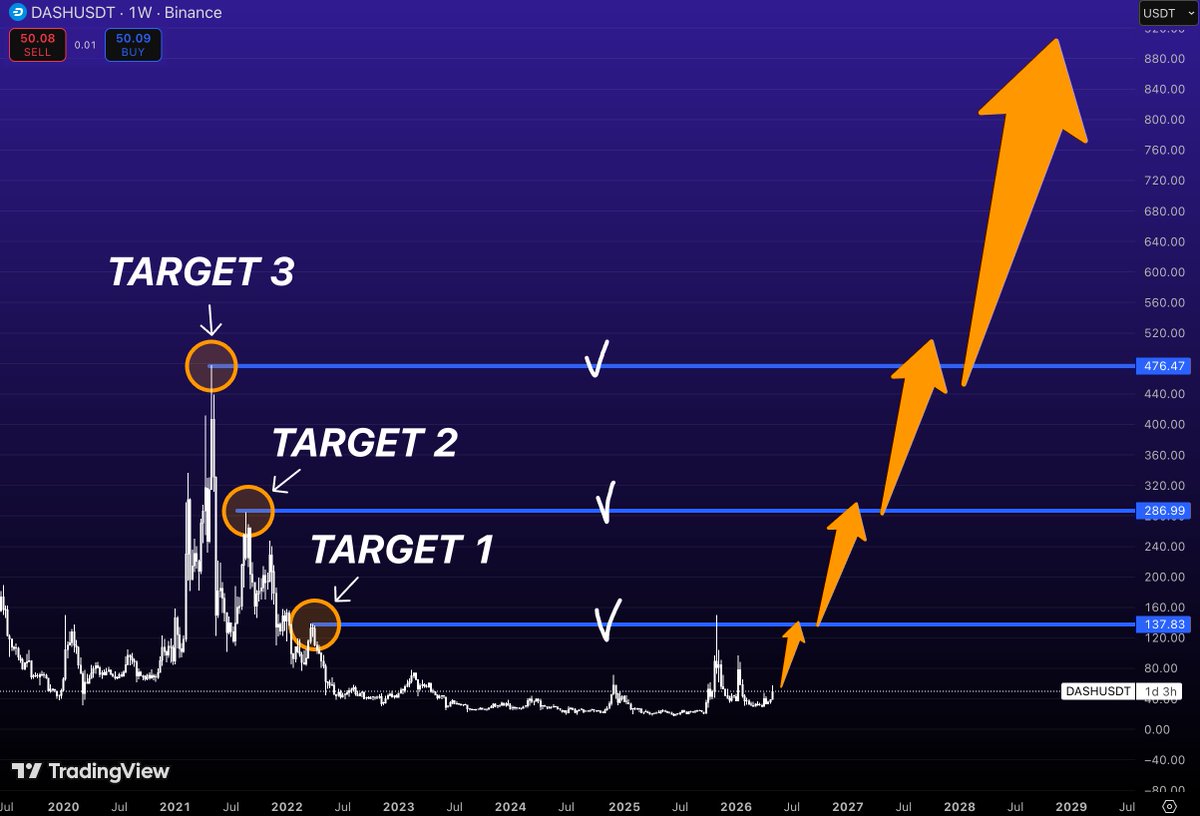
But what makes $DASH interesting is the amount of untouched liquidity sitting above current price Every blue level on this chart marks an area where massive reactions happened before $150 was the first real battlefield Above that, the chart opens into a vacuum toward $250+ And if crypto enters another strong expansion cycle, those old 2021 levels around $470 stop looking impossible very quickly Because older coins move differently They stay dead for years… then suddenly wake up with brutal momentum once rotation begins Most traders won’t touch DASH now because it feels “boring” But boring charts at the lows often become the most violent movers later Especially when nobody is positioned for them
noncler tweet media
English
0
0
2
142
noncler
noncler@nonclerr·
$ONDO spent months getting crushed by constant seller pressure Every bounce got rejected Every green candle turned into exit liquidity Then the chart completely changed character Instead of making new lows, price started moving sideways inside a tight accumulation range That’s usually where smart money starts positioning quietly while the timeline is still asleep Now look at the reaction after the breakout from that blue box Momentum instantly returned Not because retail suddenly became bullish Because supply dried up And once a chart shifts from distribution → accumulation → expansion, moves can accelerate very quickly The interesting part is that $ONDO still hasn’t entered real hype territory yet If buyers keep defending this structure, the path toward the $1+ region opens naturally And the moment $ONDO starts printing weekly candles above psychological resistance, sentiment will flip fast People always call it “obvious” after the move already happens
noncler tweet media
English
2
6
43
1.8K
noncler
noncler@nonclerr·
$FLR has been stuck in the kind of slow bleed that destroys most traders psychologically Not because the moves are violent But because the market slowly convinces everyone that nothing will ever happen again That’s what makes this chart interesting now Price spent years compressing lower while volatility completely disappeared And historically, those are the exact conditions where explosive moves tend to begin building quietly Right now there are three major reclaim zones overhead Target 1 → $0.038 Target 2 → $0.056 Target 3 → $0.090 The important thing here is not the targets themselves It’s the fact that the market has already absorbed an enormous amount of selling pressure over time Weak assets usually keep making fresh lows aggressively This one keeps stabilizing near exhaustion levels instead That changes the risk/reward profile completely Because once a long-term compression structure finally breaks upward, the move often happens much faster than people imagine Especially when almost nobody is positioned for it anymore The market spends months creating hopelessness Then suddenly starts moving before the crowd is emotionally ready to believe it
noncler tweet media
English
2
2
13
886
noncler
noncler@nonclerr·
$TEL has quietly spent multiple years building inside a deep post-cycle compression range Now the chart is beginning to show the early stages of a possible higher timeframe recovery structure Three major liquidity targets stand out clearly Target 1 → $0.0126 Target 2 → $0.0366 Target 3 → $0.0646 What makes this setup interesting is how long the market has remained dormant after the original euphoric expansion phase The speculative excess was completely removed Momentum collapsed Volume faded And attention disappeared while price stabilized near the lows That type of prolonged compression often creates the conditions for stronger trend reversals later on The first important reclaim sits around the $0.012 region That level previously acted as a major rejection zone during the decline If price starts building acceptance back above it, the structure opens toward significantly higher liquidity ranges Above that, the next major expansion area sits near $0.036 And once higher timeframe resistance zones begin getting reclaimed again, momentum can accelerate very aggressively The strongest reversals rarely begin when the market is excited They usually begin when nobody is watching anymore Compression creates the base Reclaims trigger momentum Expansion follows after
noncler tweet media
English
5
33
173
8.7K
noncler
noncler@nonclerr·
$INJ is approaching a very important stage on the higher timeframe structure After a complete market reset, price is now beginning to rotate back toward the major historical supply zones that previously defined the entire cycle Three levels stand out clearly on the chart Resistance Level → $16.7 Pump Level → $35.2 ATH Level → $52.9 What makes this structure attractive is the scale of the correction that already took place The entire euphoric expansion phase was fully unwound Momentum disappeared Leverage got flushed out And the market spent months building compression near the lows That type of price action usually creates the foundation for stronger long-term reversals The first important test sits around the $16 region That area acted as a major resistance zone during the decline If price begins reclaiming acceptance above it, momentum can accelerate very quickly toward the higher liquidity ranges Above that, the structure opens toward the previous pump zone near $35 And once prior cycle highs begin getting pressured again, expansion phases tend to become increasingly aggressive Most traders only become interested after confirmation arrives But the strongest opportunities are usually created during the exhaustion phase beforehand Compression builds the setup Reclaims shift momentum Expansion follows after
noncler tweet media
English
0
1
10
959
noncler
noncler@nonclerr·
$ONDO is starting to reclaim one of the most important structures on the chart After months of sustained downside pressure, price finally reacted aggressively from the lower accumulation range and is now approaching the first major liquidity zone near $0.62 That level matters because it previously acted as a major launch area before the breakdown phase accelerated Now it becomes the first serious reclaim test Above that sits the real macro level: ATH zone near $1.16 And structurally, this is where things get interesting The chart spent a long time bleeding lower while sentiment disappeared completely That type of prolonged compression often creates the conditions for violent upside repricing once momentum rotates back into the asset Most people focus only on coins already trending But the highest asymmetry usually appears when a market transitions from apathy back into expansion If $ONDO secures acceptance above the $0.62 region, the path toward the ATH liquidity zone opens considerably And once previous highs come into play, price discovery can accelerate very quickly The market already showed where large reactions happen Now it’s about whether buyers can reclaim those zones one by one Compression → reclaim → expansion That’s the structure developing here
noncler tweet media
English
1
2
15
985
noncler
noncler@nonclerr·
$DASH is sitting in a structure that long-term traders should pay attention to Not because price already moved Because it hasn’t For years, $DASH has traded inside a prolonged compression range after a massive macro decline from the cycle highs Most of the speculative excess has already been erased Attention disappeared Volatility collapsed That’s usually the environment where accumulation phases quietly form Now the chart is starting to show the first signs of transition The recent reclaim from the lows pushed price back into a historically important zone around $150 This level matters because previous rallies repeatedly stalled there before continuation failed If the market reclaims it decisively, the next major liquidity region sits near $248 a level tied to prior distribution during the earlier cycle structure Above that, the larger macro target opens toward the historical resistance area near $476 And structurally, those levels are not random They represent the exact zones where aggressive supply previously entered the market What makes the setup interesting is the asymmetry between risk perception and historical volatility Most participants now view $DASH as a forgotten asset from a previous cycle But historically, assets that survive extended bear markets while building multi-year bases can produce extremely violent repricing phases once liquidity rotates back into overlooked sectors Especially when supply becomes increasingly inactive over time The market also spent years conditioning traders to expect every rally to fail That conditioning creates hesitation And hesitation is often present near the beginning of larger trend reversals Right now, $DASH is still early in the structure But from a macro perspective, the chart is beginning to resemble the type of long-duration base that can eventually lead to exponential expansion once momentum fully returns
noncler tweet media
English
0
5
12
879
noncler
noncler@nonclerr·
$WLD is sitting in the same type of structure that historically produced its biggest expansions The chart looks dead to most people That’s usually where the interesting setups begin Price has spent months compressing near the base after a brutal multi-wave decline from the highs Momentum disappeared Volume faded Attention moved elsewhere But structurally, this area matters Every major rally in $WLD started from the same kind of low-volatility accumulation zone before price aggressively repriced into previous liquidity levels The market already showed where the important levels are Around $2.20 sits the first major reclaim zone Above that, the next key area is near $4.16 the level where prior rallies lost momentum and sellers regained control And if momentum fully returns, the larger macro target remains near the previous high-liquidity region around $12 That may sound unrealistic from current prices But crypto cycles repeatedly show the same pattern: Assets that spend the longest time building a base often produce the most violent trend expansions once sentiment shifts Especially when positioning becomes one-sided and the market stops expecting recovery Right now, $WLD is still trading in the disbelief phase Most participants are focused on what already happened instead of what the structure is starting to suggest The important detail is not the price today It’s the location Because historically, some of the strongest upside moves begin when an asset looks completely forgotten near long-term demand zones And structurally, $WLD is back in that zone again
noncler tweet media
English
2
5
16
1.7K
noncler
noncler@nonclerr·
$TAO continues to build one of the strongest high-timeframe structures in the market And unlike most altcoins, this chart never fully collapsed That changes everything While many assets spent years trying to recover from deep bear market damage, $TAO kept printing higher macro ranges and defending key demand zones Now price is rotating back toward the first major resistance area near $535 This level matters because it was one of the final rejection points before the last corrective phase accelerated If buyers reclaim that zone cleanly, the next major liquidity target opens near $742 And above that sits the real macro expansion level around $1,250 That’s the area where prior euphoric momentum peaked and volatility became unsustainable The broader structure here looks different from typical speculative rallies Instead of a random vertical spike, the market has been creating repeated consolidations, resets, and higher support formations That usually reflects stronger underlying demand The AI narrative also continues acting as a structural tailwind for assets tied to computational infrastructure and decentralized intelligence markets And historically, assets that maintain relative strength during weak market conditions often become cycle leaders once liquidity fully returns Most people focus on short-term volatility But the higher timeframe trend still looks constructive as long as the market continues reclaiming previous resistance zones step by step The strongest trends usually climb through levels gradually before acceleration begins
noncler tweet media
English
1
7
16
1.1K
noncler
noncler@nonclerr·
$DASH spent almost 4 years building a massive base after one of the most brutal bear market collapses in the sector That kind of structure doesn’t appear often The interesting part is that the chart already mapped out the key historical liquidity zones: → $137 → $286 → $476 These levels were major supports during the previous cycle before the entire market rolled over Now they become the exact areas traders will watch again if momentum keeps building This is how forgotten assets usually come back to life: first nobody cares then price starts reclaiming old ranges then volume returns then suddenly everyone acts surprised after a 5-10x move already happened Most people underestimate how aggressive old-school altcoins can move once liquidity rotates into them Especially coins with: long accumulation phases strong historical recognition thin supply overhead and years of trapped shorts above price The market loves recycling old names every cycle And if $DASH starts reclaiming these macro levels one by one, the move toward higher valuations could happen much faster than most expect $800 sounds unrealistic during accumulation It sounded unrealistic at $10 too
noncler tweet media
English
3
15
70
3.4K
noncler
noncler@nonclerr·
$ASTER has been bleeding for months and that’s exactly why this setup is getting INTERESTING The market already went through: post-launch euphoria aggressive distribution liquidity exhaustion complete sentiment reset Now price is slowly stabilizing after the entire downtrend compression phase This is where many strong altcoin reversals usually begin What stands out on the weekly chart is how clearly the market respects previous breakdown zones: → $0.94 → $1.39 → $2.42 Those aren’t random lines They’re historical liquidity levels where sellers previously took control And once momentum shifts, those same areas often become magnets for price Most traders only pay attention after a coin already does a 3-5x move But the biggest opportunities usually appear during the quiet phase: low volume, low attention, no hype, nobody talking about it. That’s exactly the environment where asymmetric setups are created If altseason returns with strength later this cycle, $ASTER has enough room for a violent expansion move once liquidity comes back into smaller caps
noncler tweet media
English
0
8
10
1.4K
noncler
noncler@nonclerr·
$ONDO is starting to look like one of the cleanest range-recovery setups in crypto right now After months of aggressive selling, price finally reclaimed the lower boundary of the macro range around $0.62 That changes the entire structure Now the market is entering the phase where volatility expands inside the range: impulsive rallies sharp pullbacks higher lows liquidity grabs continuation attempts And that’s usually what happens before a real breakout move begins The important level on the chart is obvious: → $1.16 That’s the upper boundary of the range and the major supply zone that rejected price previously If $ONDO starts accepting above that region, the market could reprice very fast because there’s not much resistance overhead afterward This is the type of chart that looks boring during accumulation… and suddenly becomes one of the strongest performers once momentum returns to the sector
noncler tweet media
English
0
5
19
1.7K
noncler
noncler@nonclerr·
$WLFI is approaching a decision zone price rallied straight into stacked resistance clusters around: $0.075 $0.080 $0.085+ and those zones were previous breakdown areas during the selloff right now the chart suggests two possible paths: rejection from resistance → retrace toward the $0.051 support zone breakout with acceptance above resistance → momentum continuation toward higher liquidity areas the problem for bulls is that this recovery happened very fast without much consolidation underneath that often creates weak structure and increases the probability of a pullback before any sustainable continuation for now, the resistance side still looks heavier than support especially while price remains trapped below the upper supply zones marked on the chart
noncler tweet media
English
0
3
9
1K
noncler
noncler@nonclerr·
$DASH still has one of the cleanest recovery structures among older altcoins after years of compression near the bottom, price is finally waking up again the important part is this: historical resistance zones are already mapped clearly on the chart first major target sits around $140 then the real momentum zone opens near $290 if DASH starts reclaiming those old cycle levels the move toward the macro target around $475 becomes possible surprisingly fast older coins with strong history tend to explode once liquidity rotates back into legacy narratives most traders ignore them until they’re already up 300%+
noncler tweet media
English
6
31
104
5.3K
noncler
noncler@nonclerr·
$VVV already showed the first impulsive move out of accumulation that initial pump changed the entire structure of the chart now price is cooling off inside a smaller consolidation range instead of dumping back down that’s usually a sign buyers are still in control if this range breaks upward, momentum could accelerate fast toward the psychological $20 area strong trends often move in waves: consolidation → expansion → consolidation → bigger expansion right now it looks like the market is preparing for the next leg up
noncler tweet media
English
1
2
11
750
noncler
noncler@nonclerr·
EVERY CYCLE STARTS FROM THE SAME PLACE nobody wants $CHZ down here that’s the point look left, every time this thing wakes up from the bottom it doesn’t move 20% it explodes now price is sitting near the exact zone where previous runs started and targets are already mapped out: 0.06 → 0.16 → 0.29 → 0.65 → 0.94 that’s not hopium those are historical levels the funny part? people will call it “too risky” at the bottom then call it “obvious” after 300%+ moves same cycle every time
noncler tweet media
English
1
15
55
2.9K
noncler
noncler@nonclerr·
THE FIRST TARGET IS ALREADY DONE $LUNC didn’t even hesitate clean breakout → straight into target 1 now look at the structure that’s how trends start next level is clear - 2nd target and once it breaks, it opens the path to the big one this isn’t the move people chase this is the move they realize too late
noncler tweet media
English
2
48
243
11.4K
noncler
noncler@nonclerr·
THIS FLIP IS CLEAN $ZEC spent months printing lower highs… every bounce getting sold and then quietly, that structure broke first higher low held next push made a higher high now it’s starting to trend instead of react this is how reversals actually look not one candle… but a shift in behavior if this keeps stacking higher lows $600 comes fast after that, it opens up way more than people expect most will wait for confirmation but by the time it feels safe the move is already halfway done
noncler tweet media
English
0
1
3
516
noncler
noncler@nonclerr·
plasma:native this one feels illegal to ignore price nuked → went dead → everyone forgot it exists but look where it’s sitting now same zone that started the last explosive move and now compression right at the floor this is how breakouts are born quiet → tight → then violent once that trendline goes, it’s not gonna ask for permission it’ll just send people will call it “random” after it’s already +300% but the setup is literally sitting here in plain sight
noncler tweet media
English
1
0
4
274
noncler
noncler@nonclerr·
terra-luna:native IS ABOUT TO RUN HARD Price just reclaimed a key support that used to reject it multiple times That shift changes everything resistance → support is where trends flip Strong reaction from the lows + momentum expansion = early stage of a bigger move This isn’t the top, this is where it starts getting interesting If price holds this zone, next step is simple: range high → breakout → continuation to HTF levels Most will wait for confirmation at higher prices Smart money positions at the shift terra-luna:native looks ready
noncler tweet media
English
3
38
162
9.5K