nozam99 / karma99

1.5K posts

nozam99 / karma99 banner
nozam99 / karma99

nozam99 / karma99

@nozam99

Katılım Ağustos 2020
967 Takip Edilen194 Takipçiler
nozam99 / karma99 retweetledi
Joao Wedson
Joao Wedson@joao_wedson·
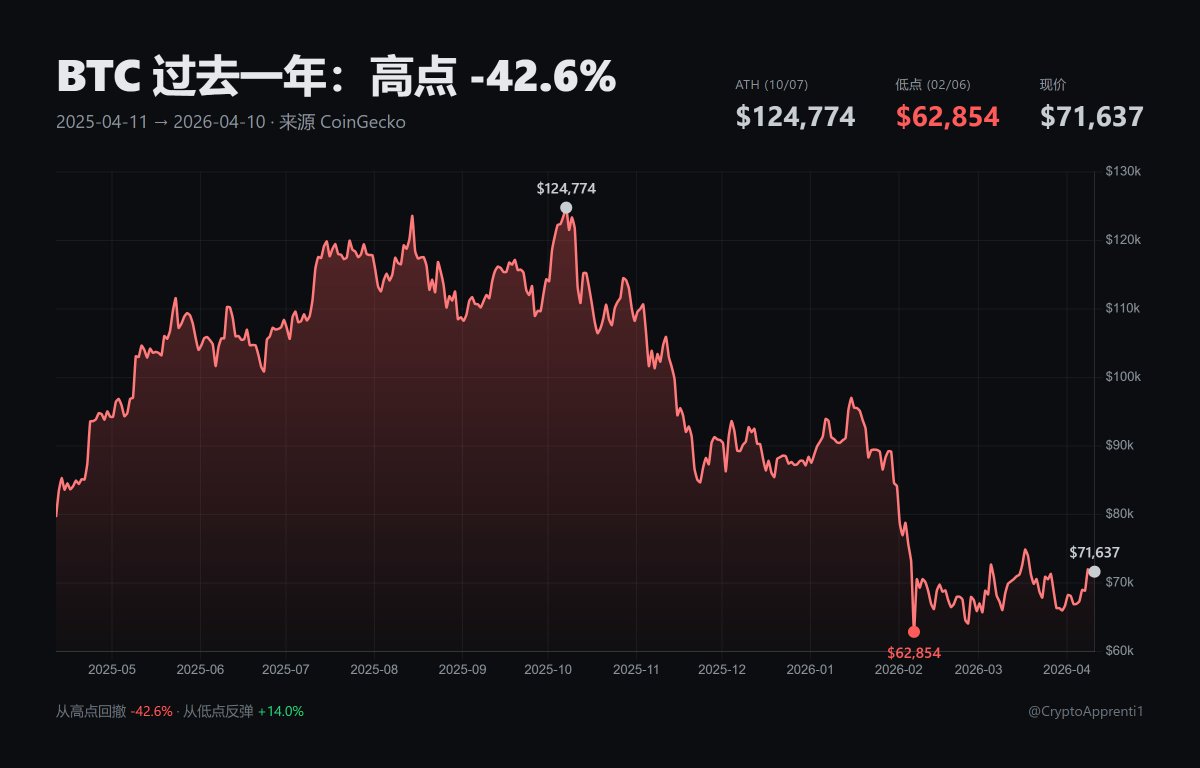
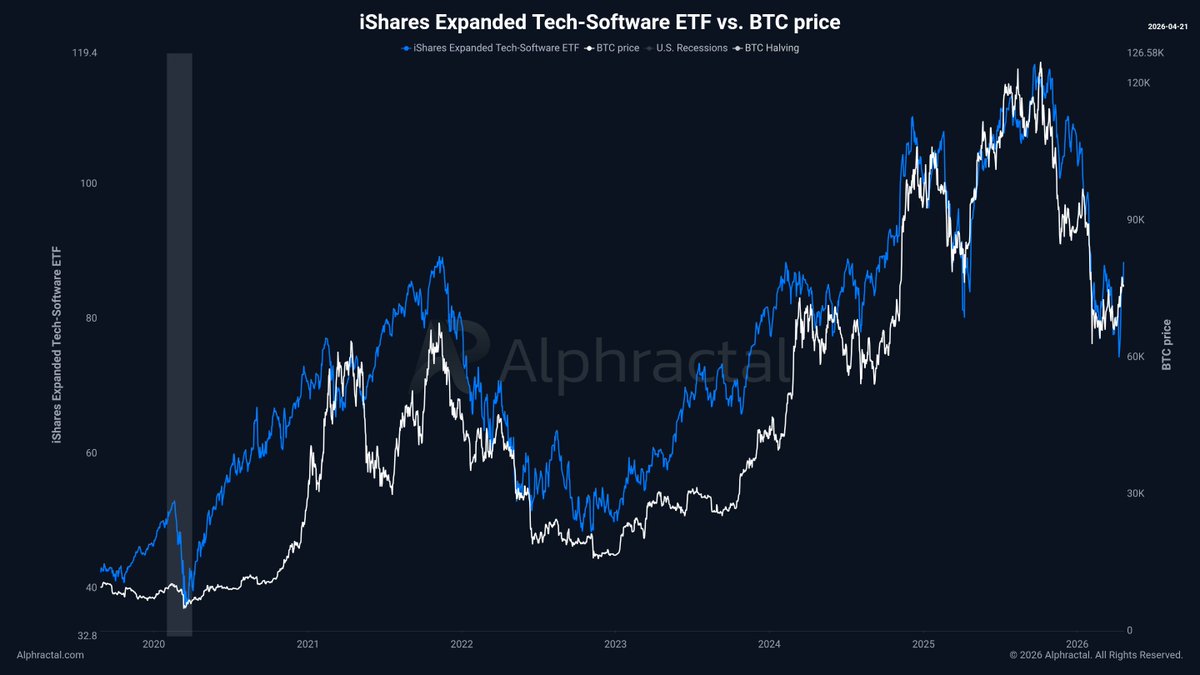
Bitcoin continues to show its strongest correlation with the SaaS and tech software sector. We’re probably among the few talking about this. And there are signals suggesting I should share more soon about why this is happening. For now, I recommend following more closely at @Alphractal
Joao Wedson tweet media
Joao Wedson@joao_wedson

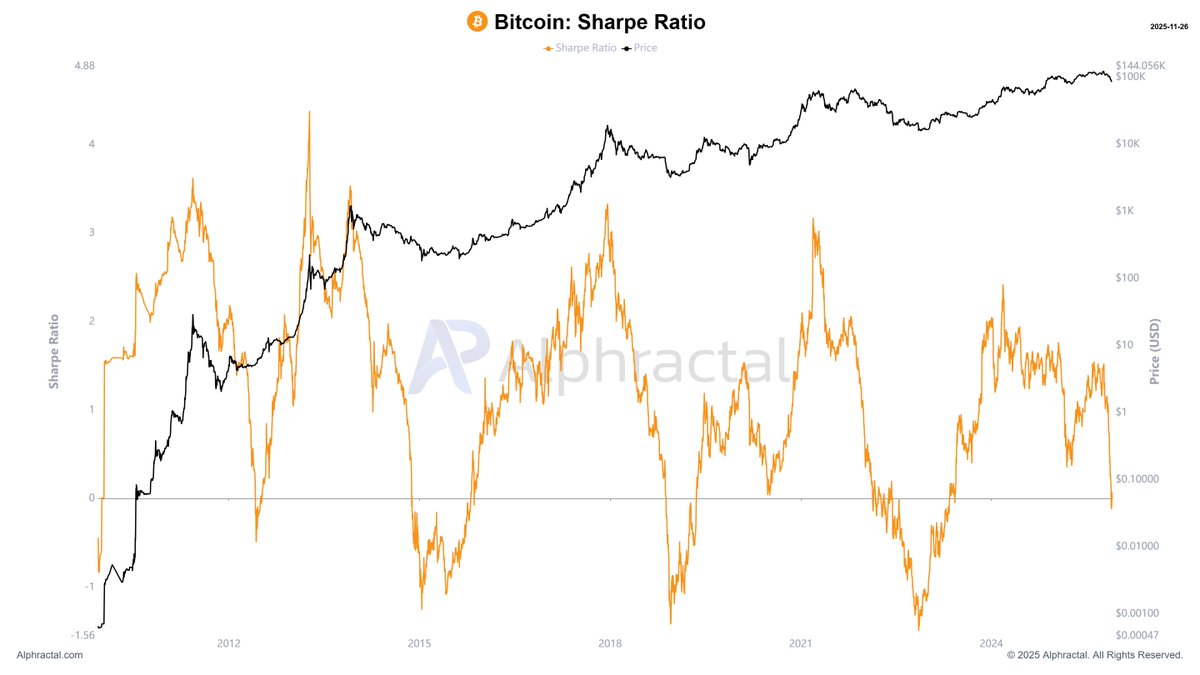
Bitcoin is currently showing its strongest correlation with the SaaS and Tech-Software sector. This signals a clear shift: BTC is behaving like a high beta tech asset, driven by liquidity, growth expectations, and valuation cycles within the software market. This is how smart capital truly sees Bitcoin. That also means the AI sector has direct points of conflict with Bitcoin, something very few are talking about.

English
4
5
88
7.9K
nozam99 / karma99 retweetledi
Dr.Hash“Wesley”
Dr.Hash“Wesley”@CryptoApprenti1·
币圈现在是衰退行业。 千万别拿衰退行业的反弹,跟上升期的回调类比。 我不相信牛市。 $BTC #Bitcoin
Dr.Hash“Wesley” tweet media
中文
44
13
157
49K
nozam99 / karma99 retweetledi
Joao Wedson
Joao Wedson@joao_wedson·
This is the story of Bitcoin’s price. This chart is magical. It tells you a lot, shows what has already happened, and can help guide you in the future. Follow Alpha at @Alphractal.
Joao Wedson tweet mediaJoao Wedson tweet media
English
8
9
66
5.8K
nozam99 / karma99 retweetledi
Joao Wedson
Joao Wedson@joao_wedson·
You have to sell your cryptocurrencies every time Google searches start increasing. It is that simple to go against the crowd. Do not forget this the next time it happens. And to update everyone, social interest in cryptocurrencies right now is at the same level as during the 2022 bear market.
Joao Wedson tweet mediaJoao Wedson tweet media
English
18
54
341
27.8K
nozam99 / karma99 retweetledi
Arch Physicist
Arch Physicist@arch_physicist·
The True Market Mean Price (also known as the Active Investor Price) is an on-chain metric derived from Bitcoin’s transaction history. It estimates the average acquisition price for active market participants by focusing specifically on coins transacted in secondary markets. By excluding BTC held by original miners, it serves as a reliable proxy for the average cost basis of engaged investors. Historically, this metric has been used as a valuation tool to indicate a "fair price" for the market based on actual investor activity. This is not investment advice. #Bitcoin #OnChain Source: @Alphractal
Arch Physicist tweet media
English
0
2
11
1.3K
nozam99 / karma99 retweetledi
Joao Wedson
Joao Wedson@joao_wedson·
Bitcoin’s fractal suggests the next cycle bottom may form around October 4, 2026. Based on historical cycle symmetry, the most favorable time window for accumulation would likely be concentrated between: 🗓 October 6, 2026 and October 16, 2026 📉 Estimated price range: $41,500 – $45,000 ⚠️ This is not a fixed rule, nor a deterministic price forecast. It represents a fractal rhyme of market cycles — something Bitcoin has historically respected more often than ignored. Markets do not repeat exactly — but they rhyme with an uncomfortable frequency. @Alphractal | Bitcoin Cycle Intelligence
Joao Wedson tweet media
Joao Wedson@joao_wedson

🚨Today marks the key day that closes Bitcoin’s fractal cycle! If the price drops significantly from here, it will prove that everyone who believed the 4-year Bitcoin cycle wouldn’t work anymore was wrong! In my last post, I share a bit more openly about what I truly believe!👇

English
63
141
521
138.6K
nozam99 / karma99 retweetledi
Joao Wedson
Joao Wedson@joao_wedson·
4chan has always been one of the main hubs for anonymous crypto discussions. It’s where cryptic messages from supposed insiders emerged — and, interestingly, some of them turned out to be remarkably accurate. Today, however, crypto-related posts on 4chan are at historical lows. Some argue that “times have changed” because of AI. But that explanation falls short. It’s not just 4chan. Crypto engagement has dropped across YouTube, X, Google, and Reddit. 🌍 Geopolitical tension and tight macroeconomic conditions have pushed two-thirds of the world into defense mode. People are simply not willing to take risk. 📉 Historically, great opportunities are born from extreme fear — it acts like a spring that eventually propels risk assets higher when no one wants to touch them. One last curiosity: Charts like this are deeply connected to that reality. Many altcoins barely react because people aren’t even talking about them.
Joao Wedson tweet mediaJoao Wedson tweet mediaJoao Wedson tweet media
English
4
5
39
5.2K
nozam99 / karma99 retweetledi
트렌더쿠
트렌더쿠@vibetaku·
강세장 선행 신호를 싹다 무시하고있는 BTC, 왜 그럴까ㄷㄷ 글로벌M2(통화량)은 사상 최고치를 경신하고있고, 금 가격도 역대 최고가를 경신중이며, 달러인덱스는 약세를 보이고 있고, 미 연준은 금리를 인하함. 이 모든건 BTC가격에 있어 전통적인 상승 선행 신호였지만 현재는 반대로 하락하고있음. 도대체 왜 그럴까 일단 미국 MMF(머니마켓펀드) 잔고가 급증한 덕분에 은행을 통한 자본시장 유동성은 늘었지만 레버리지 프라임 브로커 자금(투기성 자금)은 감소함. 즉, 증가한 장기성 자금은 주가와 금값을 상승시켰고, 감소한 단기성 자금은 BTC를 포함한 코인 시장을 끌어내렸음. 코인 시장 입장에서는 유동성 장세에 자금이 빠지는 미운오리새끼가 된셈 올해 들어선 알트코인 현물 ETF들이 하나둘 출시되었고 이것이 알트 섹터의 강세장을 발생시킬거라고 기대했었음. 그러나 본질적으로 코인 시장으로의 유동성이 제한적인데다가 대형VC의 대규모 락업이 발생하면서 ETF출시는 껍데기일뿐 알맹이가 빠진 격이 됨 더 멀리서 보면 크립토에 대한 내러티브보다 강력한 내러티브가 있으니 그것은 바로 'AI'임. 문제는 AI는 실제로 돈을 벌게 하고, 크립토는 여전히 길을 찾고 있다는 것임. 물론 AI도 거품이냐 아니냐 할 정도로 돈 먹는 하마이지만 크립토와 비교시 상대적으로 투입 대비 더 빨리 증명되는 내러티브에 투기 자본은 몰리기 마련임 그러면 왜 하필 '25.4분기에 코인시장이 글로벌 유동성과 다른 길을 가게 된걸까. 그 이유는 정치적 규제를 정비하면서 크립토를 자본 시장에 편입시키기 전에 설계자들은 그레이트 리셋을 하기로 결정한 것 같음. 즉, 크립토가 제도권으로 진입하기전 마지막 개미털기라는 것임. 또한 그렇게 리셋함으로써 아직 크립토에 제대로 진입 못한 오일머니 등이 싸게 매집할 수 있는 기회도 얻을수 있음 결론적으로, 현재 진행 중인 BTC 가격의 하락은 제도권 편입전 마지막 성장통임. BTC를 포함한 크립토 시장이 투기성 자금 외에 어엿한 유동성 자금을 만끽하려면 체질이 개선되어야하며, 설계자들은 '그때'를 기다리며 의도적 시간 벌기 구간에 돌입했다는 것임. 이에 어차피 코인 투자를 할 거라면 인내를 갖고 그들과 함께 언젠가 도래할 '그때'를 기다려야한다는 것이 나만의 결론! #어금니꽉
트렌더쿠 tweet media
트렌더쿠@vibetaku

코인 시장 역사상 가장 특이한 "현재 중장기 사이클" ㄷㄷ BTC의 중장기 사이클 저점&고점 평가 지표 중에서 최고의 지표 중 하나를 “2년 이동평균선(이평선)”이라고 생각함. 왜냐면 1)이평선은 가장 널리 알려져있고 2)가격의 과열•위축을 직관적으로 가늠할 수 있기 때문임 실제로 2년 이평선과 2년 이평선 5배수는 BTC 중장기 사이클 상 저점과 고점을 판별하는데 훌륭한 참고 지표가 되었고 세부설명을 하자면 다음과 같음 - 과거 사이클 패턴상 가격이 2년 이평선을 하회할때가 저점 매수의 기회(위축)였고 상회할때가 고점 매도의 기회(과열)이었음 - 인상적인 점은 '21년 정상은 2년 이평선 5배수를 살짝 터치할 정도로 매우 짧았고 '22년 발 바닥은 가장 길고 고통스러웠다는 점임 - 그 지옥과 같은 바닥다지기를 마치고 가격이 향하는 2년 이평선 5배수 구간은 현재 시점에서는 398,500달러로 예상됨 - 참고로 전체적으로 볼때 ‘2년 이평선’으로 확인되는 “저점 매수기간" 보다 ‘2년 이평선 5배수’로 확인되는 “고점 매도기간"이 더 짧음 - 즉, BTC 가격이 저평가 구간일때는 공포에 떨다가 정신차리고 매수할 시간이 충분한 반면, 고평가 구간일때는 환희에 취하다가는 매도할 기회를 날릴수 있다는 것임 —— 흥미로운 점은, '22년~'23년에 역대 최장 하락장을 겪었음에도 이후 도래한 상승 사이클에서의 가격 상승세는 생각보다 강력하지 않았고 오히려 현재 가격은 고점(정점) 판별에 용이한 2년 이평선 5배수가 아닌 저점(바닥) 판별에 용이한 2년 이평선에 더 근접하다는 점임 다른 차트 분석이나 온체인 분석에서도 마찬가지겠지만, 모든걸 떠나서 이 '2년 이평선 기반 사이클 흐름'에서조차 이번 중장기 상승 사이클은 상승폭, 상승률, 상승흐름, 상승기간 등 거의 모든 면에서 기존 사이클들의 그것들과 매우 다름. 이렇게 되면 '오직 BTC 홀더'들 조차 매도 등 투자 대응을 하는 난이도가 확 올라가게됨 결론적으로, 이번 사이클은 기존 사이클들과 다른 가격 흐름을 보이고 있고, 앞으로 시즌 종료가 되든 랠리 재개가 되든 '완전 새로운 길을 개척'하게 될것임. 만약 가까운 미래에 시즌종료가 온다 해도 "사이클 설계자"에 의해 결국 코인시장은 저 멀리 제 갈길 갈거라는게 나만의 결론!

한국어
14
62
365
97K
nozam99 / karma99 retweetledi
mignolet
mignolet@mignoletkr·
정말 오랜만에 대규모 비트코인이 실제 거래 목적으로 거래소에 입금되었습니다.해당 지갑의 움직임은 단순 내부 이동이 아닌, 실제 매도 트랜잭션으로 판단됩니다. 새벽에 발생한 가격 하락 역시 이 고래에서 파생된 움직임으로 해석할 수 있습니다. 이 고래의 트랜잭션 기록은 2018년까지 거슬러 올라갑니다. 시계열 순서대로 정리해보겠습니다. 해당 고래는 최초에 약 9만 4천 BTC를 보유하고 있었습니다. 1. 2018년 5월 30일, 6월 4일 약 8천 BTC 매도 2. 2020년 2월 7일, 2월 11일 약 3개의 신규 고래지갑(주황·초록·보라)으로 24,000 BTC / 37,000 BTC / 24,000 BTC 매도 3. 초록색 고래 2022년 4월 12일 ~ 23일 총 33 BTC 매도 4. 주황색 고래 2025년 8월 16일 ~ 25일 "Hyperliquid" 거래소를 통해 보유 BTC 전량 매도 5. 보라색 고래 2025년 8월 29일, 12월 12일 "Hyperliquid / Binance"를 통해 15,000 BTC 매도 현재 약 9,300 BTC 보유 중 6. 초록색 고래 2025년 10월 8일 ~ 22일 "Hyperliquid / Binance"를 통해 11,000 BTC 매도 현재 약 21,000 BTC 보유 중 📌 체크 포인트 1. 이 고래 계열에서 매도가 발생할 때마다 의미 있는 가격 하락이 동반되었습니다. 2. 이 고래는 코로나가 터지기 직전 고점에서 비트코인을 모두 팔았습니다. 3. 아직 초록색·보라색 고래는 아직 전량 매도하지 않았습니다. 이런 흔적들도 100%는 없겠지만, 하지만 이 고래의 흔적은 무시하기 어려울 정도로 가격과의 상관관계가 명확합니다. 이후 2번·3번 고래가 잔여 물량을 계속 매도할지, 아니면 다음 사이클로 넘길지는 앞으로 계속해서 지켜봐야 할 핵심 포인트입니다.
mignolet tweet media
한국어
19
44
369
100.1K
nozam99 / karma99 retweetledi
Joao Wedson
Joao Wedson@joao_wedson·
On-chain analysis is one of the most incredible things in the entire crypto market. Seriously. It’s like seeing beneath the surface of price and understanding Bitcoin’s structure in real time. And when you combine it with the CVDD Channel, everything becomes insanely clear. This indicator shows — dynamically — where the most important on-chain support and resistance zones are. No guessing, no “gut feeling.” It’s real holder behavior, especially from the oldest coins. And here comes the critical part: BTC is now sitting at the same on-chain support level it had around 29k–30k in May 2022. Back then, it tried to hold… but failed. And the bigger drop came right after. So yes, this moment demands attention. Right now, the level the market must defend is $88,000. Holding above it is essential to dismiss a more bearish scenario. As long as BTC stays below 88k, there is indeed a risk: Long-Term Holders may start selling more of their positions, because CVDD is extremely sensitive to old-coin movements — it reacts when very old coins begin to move. If that support doesn’t hold, the next natural target in the CVDD Channel is $76,800. And in a more pressured scenario, there’s structural confluence at $71,250. These are zones where the market historically finds value after capitulation phases. And just to highlight: CVDD is the most accurate bottom-spotting metric in every BTC cycle. Right now, its base value stands at $47,450 — it changes daily, but the question is: Will it hold the ultimate bear-market floor possibly in 2026? Chart: @Alphractal
Joao Wedson tweet mediaJoao Wedson tweet mediaJoao Wedson tweet media
English
15
14
149
15.8K
nozam99 / karma99
nozam99 / karma99@nozam99·
@Alphractal 모바일웹사이트에 방문해보면 X포스팅과 같은 인사이트는 찾아볼 수 없었습니다. 유료구독하는 경우 어떠한 이점이 있는지 자세히 볼 수 있었으면 좋겠습니다(이를테면 짧은 동영상으로..)
한국어
0
0
0
273
nozam99 / karma99 retweetledi
Alphractal
Alphractal@Alphractal·
📉 BTC Sharpe Ratio Drops Sharply — Signaling a Less Efficient Market in the Short Term The annualized Sharpe Ratio for Bitcoin has fallen sharply once again, and this brings an important signal for anyone tracking the market through a professional lens. The Sharpe Ratio measures risk-adjusted returns — essentially, how much return BTC is delivering for each unit of volatility. When this indicator plunges, as it did now, it means the market has lost efficiency. Why did this happen? • Volatility spiked after a sequence of rapid sell-offs • Part of the 12-month accumulated returns has been erased • Increased systemic risk weakened the quality of the trend • Aggressive movements from whales and leveraged traders amplified noise This pattern isn’t new. We saw similar behavior in 2019, at the 2021 peak, and during the 2022 capitulation — all moments that historically pointed to more challenging periods in the short to mid-term. When the annualized Sharpe Ratio breaks down, BTC typically: enters prolonged sideways phases, experiences additional corrections, and takes longer to regain trend efficiency. But here’s the other side of the story: major bull cycles have always emerged after these resets — when risk is repriced and the market reorganizes itself. In the short term, the signal is bearish. In the long term, it remains a natural part of building new cycles. We’ll keep monitoring. Enjoy our Black Friday with 70% off. Visit Alphractal.com and unlock professional crypto market analytics.
Alphractal tweet mediaAlphractal tweet media
English
3
7
54
10.9K
nozam99 / karma99 retweetledi
Alphractal
Alphractal@Alphractal·
The Delta Growth Rate just turned negative. And, at least in the past, this has never been a good sign for Bitcoin in the medium term. Every time this metric dipped below zero, even with several attempts to push higher and short-term price bounces, BTC failed to build real strength — it moved sideways and eventually kept falling for months. Will the pattern repeat this time? A quick reminder: the Delta Growth Rate compares the growth of market cap to the growth of realized cap. When it turns negative, it historically suggests that price is losing support relative to on-chain value. Let’s see how the market reacts now. Alphractal.com 🔥
Alphractal tweet media
English
2
7
55
21.8K
nozam99 / karma99 retweetledi
Mister Crypto
Mister Crypto@misterrcrypto·
If Bitcoin falls to the 200-week moving average, price would be around $55,000. Don’t bet against history!
Mister Crypto tweet media
English
117
95
425
33.4K
nozam99 / karma99 retweetledi
余烬
余烬@EmberCN·
Arthur Hayes 刚才继续通过 B2C2 和 Wintermute 卖出了 700 枚 ETH ($222 万) 和 32 万枚 LDO ($24 万)。 从昨天以来,Arthur Hayes 通过多家机构业务平台累计卖出了价值 $742 万的 ETH 及生态代币。包括:ETH、ENA、LDO、AAVE、UNI、ETHFI。 intel.arkm.com/explorer/addre… --------------------------------------------------------- 本文由 @Bitget 赞助|Bitget VIP,费率更低,福利更狠
余烬 tweet media
余烬@EmberCN

Arthur Hayes 这是计划要清仓了? 他 1 小时前又转了一些 ETH、ENA、LDO、AAVE、UNI 到 FalconX 和 Cumberland 两家机构业务平台。 他今天应该是通过多家机构业务平台 OTC 出售了价值 $496 万的 ETH 及生态代币,包括: 780 枚 ETH ($248 万)、502.4 万枚 $ENA ($138 万)、64 万枚 LDO ($48 万)、1630 枚 AAVE ($29 万)、2.8 万枚 UNI ($21 万)、13.2 万枚 $ETHFI ($12 万)。 intel.arkm.com/explorer/addre… --------------------------------------------------------- 本文由 @Bitget 赞助|Bitget VIP,费率更低,福利更狠

中文
24
5
36
62.2K
nozam99 / karma99 retweetledi
Alphractal
Alphractal@Alphractal·
🏡 Housing Starts, S&P 500 and Bitcoin — the silent warning almost no one is paying attention to The number of new privately-owned homes being built in the U.S. (Housing Starts) is one of the most sensitive early indicators of economic momentum. And when you line it up next to the S&P 500 and Bitcoin, the message becomes surprisingly clear. 1) Housing Starts are weakening — and that has never been a good sign Every time this indicator trends down for a sustained period, the economy loses strength shortly after. And not long later, the S&P 500 usually reacts: consumer demand slows, credit tightens, companies turn defensive. That is exactly the picture we have today: Housing Starts weakening / S&P 500 at all-time highs. This divergence historically comes before periods of higher volatility in equities. 2) And what about Bitcoin? It behaves differently While equities are glued to the Fed’s next move, BTC tends to perform better in environments where: economic activity cools, liquidity begins to return, and policy-rate uncertainty declines. The chart makes this visible: several major BTC trends began right after Housing Starts rolled over and the S&P started showing signs of fragility. Bitcoin doesn’t depend on the housing cycle — it depends on liquidity and capital flows. And that environment is slowly turning in its favor again. 3) What is this trio signaling right now? ✅ Housing Starts remain weak → the economy lacks real momentum ✅ S&P 500 looks stretched → risk of a technical correction ✅ BTC holding strong → waiting for the next liquidity wave In simple terms: the bigger risk today is in traditional markets, not in Bitcoin. If the Fed eases in the coming months — and the data keeps pointing in that direction — BTC may be one of the main beneficiaries. Alphractal.com
Alphractal tweet mediaAlphractal tweet media
English
2
7
41
4.7K