Wick

138 posts

Wick banner
Wick

Wick

@ox__Wick

Structure • Liquidity • Order flow • Cycles No hype. Just theory, logic & probability.

New York, USA Katılım Kasım 2024
14 Takip Edilen79 Takipçiler
Sabitlenmiş Tweet
Wick
Wick@ox__Wick·
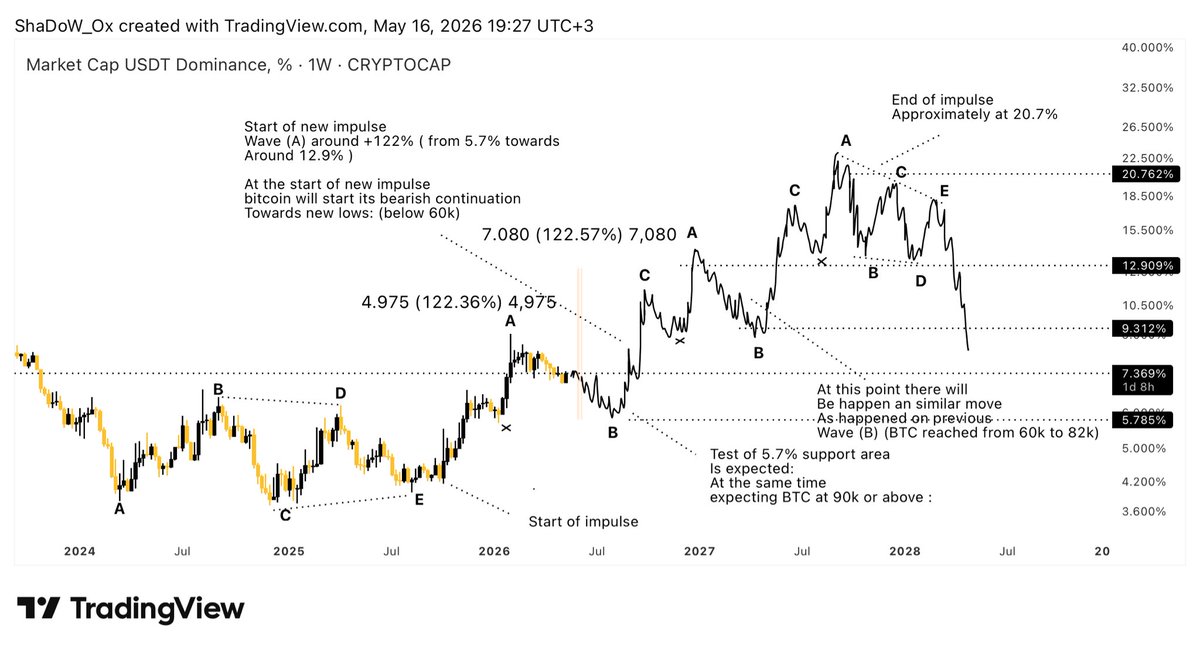
#USDT.D — Weekly Outlook The chart suggests that USDT Dominance may be preparing for a new impulsive bullish move after completing a large correction structure. Wave (A) around +122% (from 5.7% toward around 12.9%) The second bullish impulse (wave A) is expected to push USDT Dominance from the important 5.7% support zone toward approximately 12.9%, resulting in a move of around 122%. At the start of new impulse Bitcoin will start its bearish continuation towards new lows (below 60k) Rising USDT Dominance usually means capital is leaving crypto assets and moving into stablecoins. According to this scenario, Bitcoin could continue its bearish trend and potentially drop below 60k during the early stages of the impulse. Test of 5.7% support area is expected Before the second bullish move begins, USDT Dominance may revisit and confirm the 5.7% level as strong support. At the same time expecting BTC at 90k or above While USDT Dominance tests support, Bitcoin could temporarily rally toward 90k+, similar to previous market behavior before a larger correction starts. 
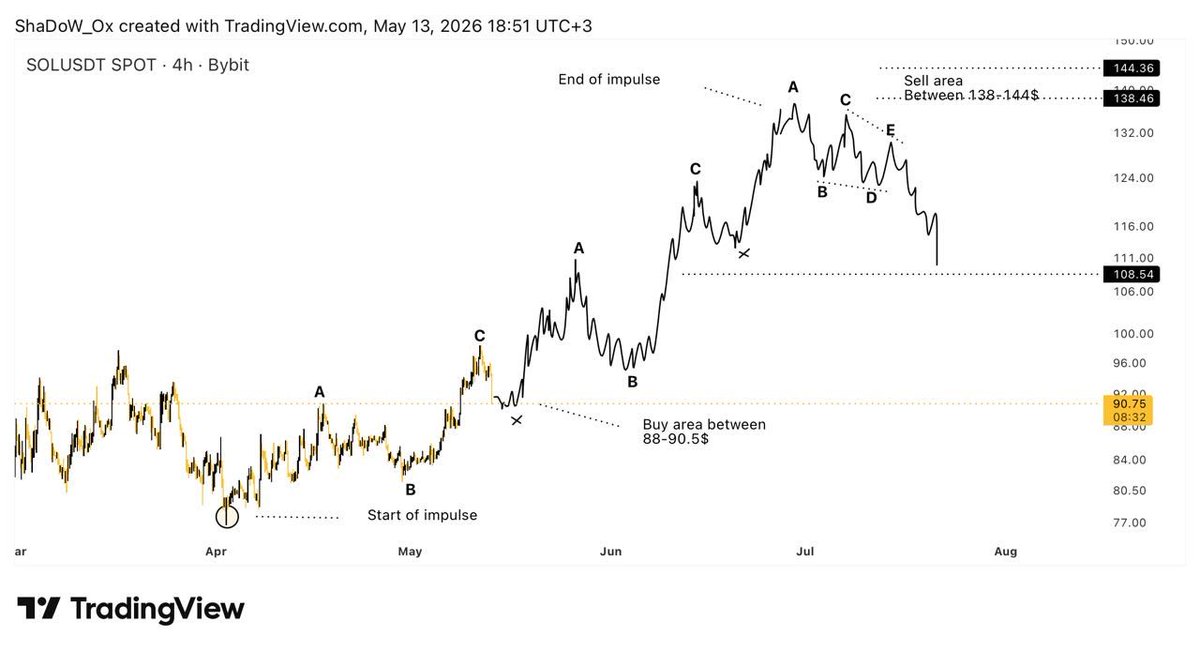
tradingview.com/x/Ui3HPZO5
Wick tweet media
English
0
0
1
295
Wick
Wick@ox__Wick·
#MOG (1W) — Outlook Current structure suggests a long-term accumulation phase is forming after the major bearish decline. Price is holding inside a key demand zone while building a possible multi-year corrective pattern. A relief rally toward the 0.7–0.93$ region remains possible and could provide a strong sell/redistribution area before the next bearish leg. The projected structure shows: • Accumulation → impulsive recovery • Distribution near resistance • Final correction into deeper support • Potential macro reversal after completion tradingview.com/x/cXbHabB8
Wick tweet media
English
0
0
0
68
Wick
Wick@ox__Wick·
#PNUT (1W) — Outlook Pnut still looks trapped inside a long-term bearish structure. 📉 The chart suggests the main bearish impulse is not finished yet, but a short-term relief rally could happen before continuation to lower levels. Current expectations: • Short-term bullish move toward the $0.12–0.14 sell zone • After rejection, another bearish leg could begin • Major accumulation area sits around $0.008–0.01 Market structure currently looks like: Bearish impulse → Temporary recovery → Final capitulation → Accumulation → New bull phase tradingview.com/x/RWiH3Fvw
Wick tweet media
English
0
0
1
109
Wick
Wick@ox__Wick·
#BTC update This month seems to be boring.
Wick tweet media
English
0
0
2
110
Wick
Wick@ox__Wick·
#BSB (1D) — Outlook Key levels I’m watching: • Main buy zone: $0.27–0.30 • Major sell area: $3.8–4.2 • Current structure still looks bearish until strong support confirmation appears The idea here is simple: Distribution → Breakdown → Accumulation → Expansion If price reaches the lower demand zone and starts building strength, that could become the best area for long-term positioning with high RR potential.
Wick tweet media
English
0
0
2
201
Wick
Wick@ox__Wick·
#WLD (1W) — Outlook WLD continues to follow a large corrective structure after completing its major bullish impulse. Price action suggests the market is still in a long-term bearish cycle, but a short-term recovery move is likely before continuation lower. Currently, the chart indicates a potential bullish impulse toward the 0.75$–0.77$ resistance zone. This area acts as a key sell region where strong rejection is expected. If price reaches this level, it could complete another corrective wave before bearish continuation resumes. Main scenario: Short-term bullish move toward 0.75$–0.77$ Possible rejection from resistance Continuation of the broader downtrend afterward Long-term outlook: The analysis suggests WLD may eventually form a major accumulation range between 0.0500$–0.0437$, which could become the final bottoming area and the end of the bearish impulse structure. tradingview.com/x/oVX8ZrEr
Wick tweet media
English
0
0
0
292
ELARA ♡ ̆̈
ELARA ♡ ̆̈@CryptoElara·
🚀 $AVAX is holding the trendline at $10.11 and testing a massive resistance zone Breakout for $AVAX here predicts a rally from $10.11 toward a $AVAX target of $13.00 #AVAX #Crypto #Bullish
ELARA ♡ ̆̈ tweet media
English
8
12
125
12.3K
Wick
Wick@ox__Wick·
#BTC.D Btc Dominance is reached key resistance area , from where I’m expecting correction around 10% Once the dominance correction starts, many altcoins could experience significant upside moves. Expected altcoin expansion could range around 80–300% before the next bearish continuation phase. This is the reason that we are holding long positions on altcoins :
Wick tweet media
English
1
0
5
874
Wick
Wick@ox__Wick·
#IMX Patience is the key.
Wick tweet media
English
0
0
1
108
Wick
Wick@ox__Wick·
#Sui Sui got more correction than expected But however, the plan is still same Not expecting any big downside move before testing 1.9$ -2$ supply zone
Wick tweet media
English
0
0
2
260
Wick
Wick@ox__Wick·
#ETH (1D) — Buy setup Accumulate between 2160-2200$ Short term target “ sell area “ 2640$ Stop loss below 2100$
Wick tweet media
English
0
0
0
89
Wick
Wick@ox__Wick·
#ETH 2780-3030$ supply zone should be tested: Before bearish continuation.
English
0
0
1
135
Wick
Wick@ox__Wick·
#BTC 19700$ #ETH 650$ #SOL 17$ Here are the price values I expect in this Bearish cycle:
English
0
0
2
291
Wick
Wick@ox__Wick·
#EIGEN (1W) — Outlook EIGEN continues trading inside a strong macro downtrend, but current price action suggests a short-term bullish impulse could develop before the next bearish continuation. The chart shows a possible corrective ABC structure already completed, with price attempting to build a temporary recovery phase. As long as momentum holds, I’m expecting a move toward the 0.47$ – 0.52$ resistance zone, which also acts as a major sell area. After reaching that region, bearish continuation remains the primary scenario, with the market potentially forming another larger corrective structure before continuation lower. Main zones to watch: • Short-term bullish target: 0.47$ – 0.52$ • Major sell/resistance area: 0.4700$ – 0.5200$ • Long-term accumulation zone: 0.0360$ – 0.0328$ Overall structure still remains bearish on the higher timeframe, but volatility and relief rallies are expected before any larger continuation move.
Wick tweet media
English
0
0
3
446
Wick
Wick@ox__Wick·
#FIL/USDT (1W) — Outlook FIL remains in a long-term bearish structure, but the chart now suggests the possibility of a short-term bullish recovery before continuation of the larger downtrend. After completing a major corrective move, price appears to be forming an accumulation base near historical lows. A bullish impulse toward the 3.7$ resistance area is currently expected. Key levels to watch: Major support zone: 0.021$ Main sell area: around 3.725$ The projected structure indicates a recovery phase with multiple corrective waves before reaching the higher resistance region. If momentum continues building, FIL could see a strong rally toward the marked sell zone. However, the broader market structure still remains bearish on the higher timeframe, so reactions around the 3.7$ area will be important for determining the next major direction.
Wick tweet media
English
0
0
2
268
Wick
Wick@ox__Wick·
#KAIA (1W) — outlook bullish impulse toward the 0.0966$–0.1066$ resistance area is expected before any major bearish continuation. This zone acts as a key supply area and could provide a strong rejection if reached. Main levels to watch: ~Accumulation zone: 0.0219$–0.0244$ ~Major sell zone: 0.0966$–0.1066$
Wick tweet media
English
0
0
1
151
Wick
Wick@ox__Wick·
#APT / USDT (1W) — Outlook APT continues to follow a large corrective structure on the weekly timeframe, and current price action suggests a short-term bullish impulse before the broader bearish continuation completes. The main expectation is a recovery move toward the 2.8$ resistance zone, which aligns with a key sell area and potential completion of the current corrective wave structure. After reaching the 2.8$ region, the market may enter another major bearish leg targeting the long-term accumulation zone around 0.1500$–0.1800$. That lower region is expected to become the foundation for the start of the real macro bull phase, where long-term trend reversal and strong expansion could begin. Key Levels: Bullish target: 2.80$ Major resistance / sell zone: 2.80$ Long-term accumulation area: 0.1500$ – 0.1800$ Macro bullish continuation expected after accumulation
Wick tweet media
English
0
0
1
260
Wick
Wick@ox__Wick·
#SOL (4H) — buy setup Entry between 88-90.5$ Targets 116-127-138$ Stop loss is not necessarily: but below 76$ Leverage 5-10x 1% margin (max)
Wick tweet media
English
1
1
3
926