Panic Sell Weekly@panicsellweekly
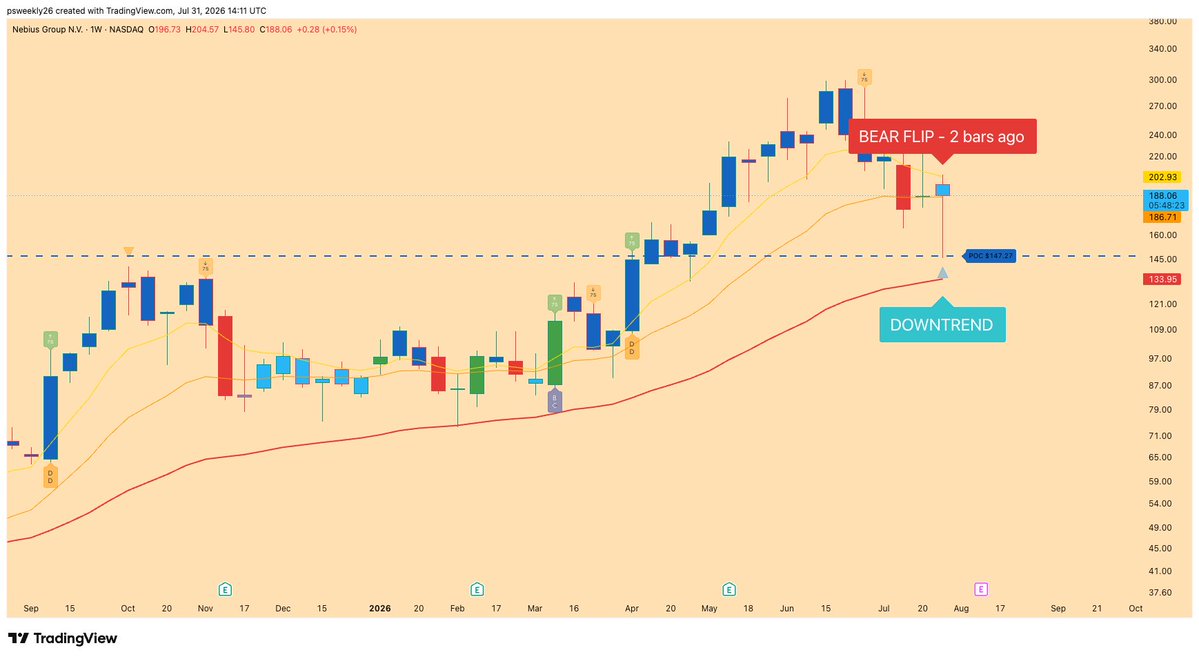
⚡ Yesterday we flagged $NBIS on the weekly — Bear Flip confirmed, Downtrend (which is likely getting reversed today to a bull flip). Today, here's the monthly.
Bull Flip fired 13 months ago. Trend state still reads Uptrend. All MAs Aligned confirmed bull, Strong Trend confirmed bull — that combination actively suppresses bear signals from firing on this timeframe. POC sits at $148.32; price is still trading well above it at $188.43.
Same stock. Same day. Two completely different pictures, depending on which timeframe you're looking at.
This is exactly why timeframe matters more than most people give it credit for. A weekly Bear Flip tells you something real — near-term momentum shifted. But the monthly chart is where the dominant, structural trend actually lives. Zoom out too little and you'll trade every wiggle like it's the whole story.
Neither read is "wrong." They're answering different questions. Weekly: what's happening right now. Monthly: what's the actual trend underneath it all.
Check every timeframe before you decide what a chart is telling you and since the monthly candle closes today, this chart matters most.