Benny Lau

172 posts

Benny Lau banner
Benny Lau

Benny Lau

@physiosign

Vice President @ PhysioSign USA | Non-invasive Bundle of His electrogram🫀| Built on 15m recordings | 53 US & International patents | CE MDR Certified

Hong Kong Katılım Ağustos 2024
3.3K Takip Edilen1.3K Takipçiler
Sabitlenmiş Tweet
Benny Lau
Benny Lau@physiosign·
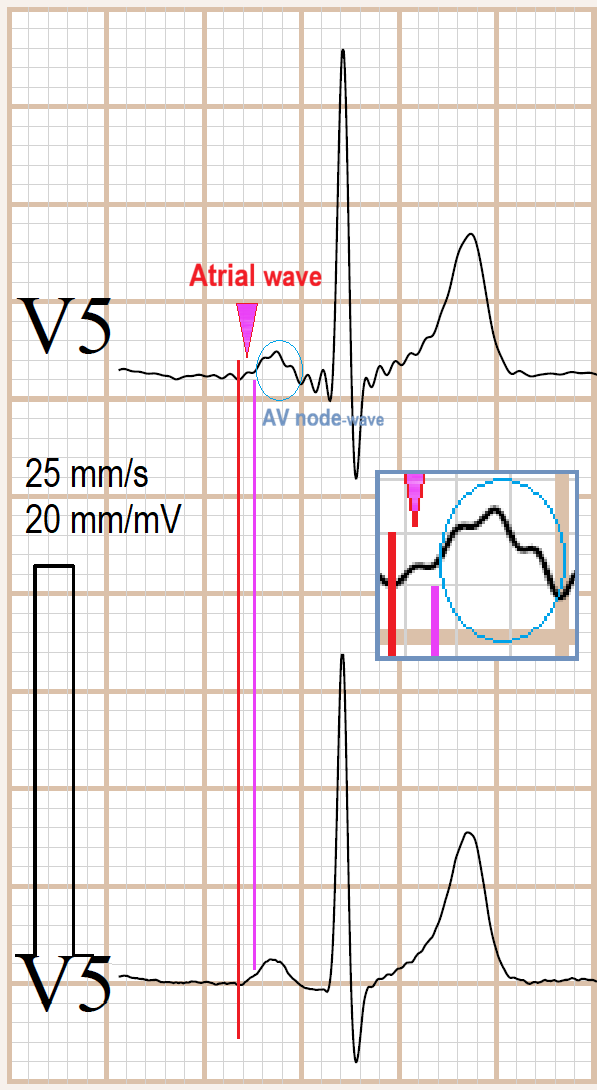
Atrial Repolarization As physicians, we use the electrocardiogram (ECG) almost daily, and electrophysiologists rely on it during surgical procedures. Yet, the ECG continues to hold many mysteries. Today, we will explore the first mystery of the ECG: Where is atrial repolarization? Why is it not visible? It is not addressed in textbooks or electrophysiology literature. Does it exist? If so, why is it not displayed? As is well known, the P wave of the ECG represents atrial depolarization in each heartbeat. Where there is depolarization, there must be repolarization, yet the ECG does not display it. Some physicians suggest that repolarization occurs in the P-R segment, which appears horizontal. However, repolarization should manifest as a negative wave, given that depolarization (the P wave) is a positive wave. This mystery lies hidden within the heart: the ECG records atrial depolarization as the P wave, but why is repolarization not recorded? In 2017, electrophysiocardiograms (EpCGs) were recorded for the first time in the PhysioSign Lab. These revealed, for the first time, electrophysiological electro-structure graphs of the entire heart—a map of human life. The essence of life is the vitality of the heart, driven by its electrical activity. The EpCG unveils many of the heart’s mysteries, starting with the location of each heartbeat, which originates definitively from the sinoatrial node (SAN), the source of every heartbeat (to be continued in our next discussion). From the EpCG images, the first secret revealed is atrial repolarization. Consider the image: atrial depolarization and repolarization are both recorded, whereas the conventional ECG only shows atrial depolarization. The EpCG uncovers the secrets of the ECG. As a continuous recording system, it provides a deep understanding of electrophysiology, analyzing many cardiac mysteries for the first time. Unlike invasive techniques, which capture only local point potentials, the EpCG reveals the full scope of the heart’s electrical conduction. From the EpCG, we observe that the P wave of the traditional ECG compresses the highest atrial frequency—essentially folding all frequency signals into a simplified, string-like representation—while the atrial repolarization signal, the core of the X-axis, remains hidden at the center. The primary challenge of the ECG is its limited signal display. Unlike medical imaging techniques such as CT, X-ray, or MRI, which provide detailed visuals, the ECG relies on estimation and interpretation. It reveals far less than electrophysiological science demands. Even invasive methods fail to capture the anatomical context, positioning the ECG as one of the oldest and most empirical tools in medical science. PhysioSign USA #ekg #ecg #electrophysiology #medtech #innovation #ai #cardiology
Benny Lau tweet media
English
1
12
36
3.2K
Benny Lau
Benny Lau@physiosign·
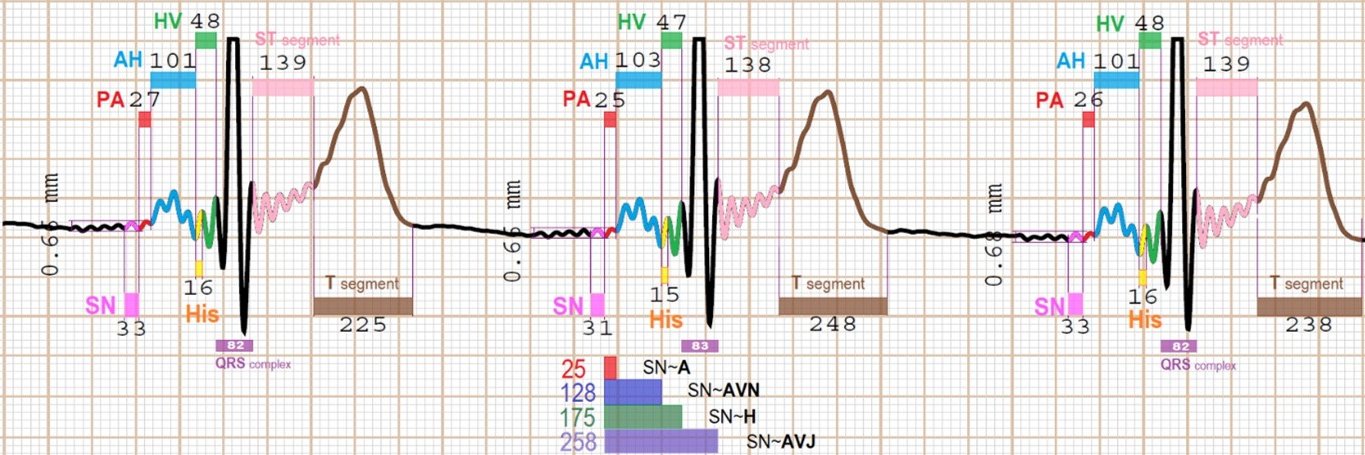
Atrial Fibrillation The heart is an “elastic mucous organ” that carries micro-electric potentials. Undoubtedly, the ECG is the most direct electrophysiological recording of human life. Invasive electrophysiological test directly probe the Bundle of His, while traditional ECGs only record the life trajectories of the atria (P-wave) and ventricles (T-wave). What is missing between them is the local potentials and membrane potentials of the cardiac self-conduction-system. The new ECG (saahECG) fills this gap. For example, within a single P-wave (typically 120–210 ms), the new ECG can clearly display the sequence: Atrial-wave → AVN-wave → His bundle-wave → Bundle branch-waves → Purkinje fiber waves. (Please refer to the attached figure.) 🫀Atrial Fibrillation (A-fib) In cases of Atrial Fibrillation often without obvious F-waves, traditional ECGs often struggle to make a clear diagnosis. This is especially true for paroxysmal AF or non-sustained AF, where there is no fixed focal source. The chaotic wavelets appear and disappear constantly. The longer the disease duration, the more severe the atrial fibrosis and the greater the number of fibrillation sources. As a result, many AF patients do not exhibit visible F-waves on standard ECGs. 🫀The new ECG does not rely on F-waves. It only needs take to look at the AVN wave in each heartbeat. When the electrical potential traveling from the atrium to the AVN fails to reach the conduction threshold, the AVN wave amplitude decreases significantly and falls below the His bundle amplitude — this indicates Atrial Fibrillation. This detection works even in silent, concealed, paroxysmal, or non-sustained AF, including AF originating from the pulmonary veins, left atrial posterior wall, septum, left atrial appendage, right atrium, or widespread substrate areas. 🌟The most critical advantage is that even during periods when Atrial Fibrillation is not actively fibrillating (i.e., normal sinus rhythm on surface ECG), the new ECG can still detect the presence of AF, while traditional ECGs show no abnormality. For patients with long-term and severe Atrial Fibrillation, most of them have no F-wave, and they often suffer from severe arrhythmias or ventricular arrhythmias. As a result, they lose the opportunity to have a pacemaker implanted. 💡Total sample size: Over 15 million 🫀AF Image display rate: 99.99% 🥇AF AI detection rate: 97% ✅Occult AF rate: 93% (From 0% to 93%) ✅AF (without F-wave): 93% (From 0% to 93%) 🥇AF correlation rate: 99% 💡False positive rate: 3% 💡False negative rate: 0.5% PhysioSign CE MDR Certified #ecg #electrophysiology
Benny Lau tweet media
English
1
2
10
275
Benny Lau
Benny Lau@physiosign·
ionic signal (saahECG) vs cellular signal (standard ECG) It is perhaps easiest to explain this using WPW images. The electrophysiological principle of WPW is that ventricular depolarization is pre-excited via an accessory pathway and occurs at the end of the AV node (AVN). The position of the His bundle and the bundle branches is anatomically fixed. Therefore, the diagnostic criteria of traditional ECGs originate from anatomical electrophysiology. The classic image shows a shortened P-R interval (<120 ms, which is abnormal — note that the normal SAN→AVN conduction time upper limit is 120 ms) and a widened QRS duration (>120 ms, also abnormal).  Why is this maximum value considered normal in the diagnostic framework? It is because the normal HV interval ranges from 30 to 55 ms on average. Ventricular pre-excitation ends in the AH interval before the HV interval begins, since the atrial conduction time [PA interval + AH interval] is <120 ms. This is one of the key rules for assessing pre-excitation: the ventricles are activated before atrial conduction is complete. However, atrial conduction continues through the HV interval, causing the QRS complex to widen due to fusion with the pre-excited ventricular activation. As a result, the normal average QRS duration (<80 ms) becomes prolonged (>120 ms).  These are all remarkable historical conjectures that are consistent with physiology, pathology, electrophysiology, and anatomy. The new ECG (saahECG) records ion-level signals. It can sample and display microvolt (μV) ion signals within the widened QRS complex, thereby revealing the His bundle notch and the extremely small waves from the left and right bundle branches.  In contrast, conventional ECGs only record millivolt (mV) cell-level signals. Consequently, the fine electrical activity within the widened QRS is not visible. For the first time, the high-sensitivity imaging of the new ECG has confirmed the historical delta wave conjecture of WPW and will also help validate or correct some previously inaccurate assumptions. Since the left and right bundle branches divide into two separate pathways, stronger electrical potential is required for conduction. In cases of abnormality, the activation position may shift over time, causing signals to appear after QRS pre-excitation — further confirming the WPW mechanism. The His bundle connects to the AVN at its anterior end and to the left and right bundle branches at its posterior end. This middle segment conducts unidirectionally and normally produces no visible signal. Therefore, when it is superimposed within the QRS pulse wave, only a notch is displayed. ***Core Knowledge The physical scale, energy, and conduction units of ionic signals are far smaller than those of cellular signals. The physical principles of the new small waves***
Benny Lau tweet media
English
1
3
26
977
Benny Lau
Benny Lau@physiosign·
🫀 Further Discussion on Atrial Fibrillation (A-Fib) Stanford professor pointed out that in the United States, the assumed 2-year undiagnosed AF prevalence was 23% (1,531,000) of the total prevalent patients with AF (6,568,000). Undiagnosed (vs. diagnosed) AF, about 591,000 undiagnosed out of 5.628 million in 2015. The most frequently asked questions concern Atrial Fibrillation: 🙋‍♂️On a new ECG, in which time segment within the P wave does atrial fibrillation occur? 🩷 Electrophysiological Analysis From the sinus node (SAN) to the atrium (each heartbeat originates from pacing and spreads across the atria). In invasive electrophysiological studies, this is the P-A interval. This segment has the shortest duration and fastest conduction, with normal values of 20–35 ms. 🩷 Anatomical Analysis: Atrial fibrillation occurs in the time segment between the atrionector [sinus node] and the [AV node], where electrical potential energy triggers fibrillation. 🩷 Traditional ECG Analysis: When the sinus node reaches its maximum threshold of stored electrical impulse, it initiates a heartbeat, which appears as the starting point of the P wave on a conventional ECG. To the left of the P wave onset in traditional ECG tracings is a horizontal straight line (often the P wave onset cannot be clearly confirmed because it forms a rounded arc). Why is it a horizontal straight line? Because 99% of the signals recorded by ECG are high-frequency signals, and before a heartbeat, high-frequency activity appears as a horizontal line. 🩷 New ECG Analysis: Observe two leads: Lead II is primarily vertical (superior-inferior orientation), and Lead V5 is primarily horizontal (anterior-posterior orientation). This records the atrial wave. Therefore, identifying atrial fibrillation is not difficult. Because atrial fibrillation involves trembling/quivering within the atria, it will inevitably affect the AV node image display following the atrial wave. Even more challenging and prone to missed diagnosis are cases where A-Fib accompanies other conditions (such as AMI, CAD, ACS, Heart Failure, CLBBB, CRBBB, Atrioventricular block, premature beats, escape beats, WPW syndrome, pulmonary embolism, COPD, tachycardia, complete ventricular block, etc.). This makes the automated read images and automated data from the new ECG even more essential. 💡 Total sample size: Over 15 million 🫀 A-fib Image display rate: 99.99% 🥇 AI detection rate: 97% ✅Occult A-fib: 93% (From 0% to 93%) ✅A-fib (without F-wave): 93% (From 0% to 93%) 🥇 A-fib correlation rate: 99% 💡 False positive rate: 3% 💡 False negative rate: 0.5% **CE MDR certified PhysioSign
Benny Lau tweet media
English
0
4
24
1.3K
Benny Lau
Benny Lau@physiosign·
Honoring the Giants Who Shaped Modern Cardiac Electrophysiology Today, I want to pay tribute to two extraordinary pioneers whose groundbreaking work laid the foundation for our understanding of the heart’s electrical system: Dr. Brian F. Hoffman — A true legend in basic cardiac electrophysiology. Through his pioneering experiments on canine hearts, Dr. Hoffman mapped the anatomical origins of the EKG’s P-R interval and advanced our knowledge of specialized conduction tissues. He is widely regarded as one of the greatest electrophysiological scientists of our time and a key pioneer in invasive heart technologies. Dr. Anthony N. Damato — Who took foundational basic science and translated it into clinical practice. Dr. Damato made critical contributions by refining our understanding of the PR interval and developing techniques that enabled the recording of His bundle electrograms in humans — a milestone that essentially launched the field of clinical cardiac electrophysiology. If the third industrial revolution had happened in the 1960s, Dr. Brian F. Hoffman would most likely have been the inventor of the new ECG. Their combined legacy continues to influence every ECG we read today. We stand on the shoulders of these remarkable scientists. Their work reminds us that true innovation is built on deep scientific understanding and continuous advancement. Progress in cardiology is only possible because of the visionaries who came before us. #Cardiology #Electrophysiology #ECG
Benny Lau tweet media
English
1
38
96
4K
Benny Lau
Benny Lau@physiosign·
Top row (Conventional ECG): The P wave has a rounded, arc-shaped onset and offset. The transition from the end of the P wave to the beginning of the QRS complex forms a curved (arc) angle rather than a sharp angle. This makes it difficult to accurately locate the starting point of the PR interval, resulting in measurements that are highly subjective and less precise. Bottom row (saahECG): The P wave ends with a clear, sharp acute angle. The junction between the P wave and the PR segment is well-defined and distinct. This allows for precise and reproducible measurement of the PR interval. PhysioSign
Benny Lau tweet media
English
1
5
17
819
Benny Lau
Benny Lau@physiosign·
Clinical Value of a New Detection Method for Atrial Fibrillation (AF) AF is one of the most common cardiac diseases, affecting approximately 25% of people over the age of 65. It is also a leading cause of stroke. In 2015, the United States alone reported approximately 1.5 million undiagnosed AF cases, accounting for roughly 11% of all AF patients. These individuals were unable to receive timely treatment. Globally, an estimated 35 million people with covert (silent) AF remain undiagnosed. AF significantly increases the risk of stroke, which is life-threatening. Heart attack and stroke are the leading causes of death worldwide. History of Diagnostic Tools The electrocardiogram (ECG), which has remained fundamentally unchanged since 1903, is still the only widely used diagnostic tool for AF. No other device has been able to reliably detect it. However, AF originates as fibrillation in the atria, while the ECG’s P-wave represents the entire atrial electrical activity (including the atrium, atrioventricular node, His bundle, and bundle branches). Traditional ECGs cannot independently display detailed atrial activity, resulting in low detection rates. A new ECG technology introduced in 2016 can detect F-waves in AF, including very rapid AF, very slow AF, and pre-symptomatic (silent) AF that traditional ECGs often miss. This is possible because the new system records different and more specific cardiac biomarkers. Two Key Reasons for Superior Performance: 1. Dual ECG Scanning — PhysioSign simultaneously uses both traditional and new ECG technologies. 2. Advanced Imaging — The new ECG can visualize the sinoatrial node (SN), atrium, atrioventricular node (AVN), and His bundle. This enables not only precise diagnosis but also accurate localization of the problem. ***The underlying principle is straightforward: during AF, chaotic atrial activity prevents normal electrical signals from reaching the AVN. The saahECG clearly detects and displays the AVN images, which are divided into three distinct parts: AN, N, and NH*** PhysioSign’s non-invasive detection of the PA interval is a historic first. Previously, the PA interval could only be measured through invasive electrophysiological studies, which were unable to detect AF. The PA interval represents the time from the sinoatrial node’s pacing signal to its conduction through the atrium — an interval not visible on ECGs. 💡 Total sample size: Over 15 million 🫀 Image display rate: 99.99% 🥇 AI detection rate: 97% ✅Occult AF rate: 93% (From 0% to 93%) ✅AF (without F-wave): 93% (From 0% to 93%) 🥇 AF correlation rate: 99% 💡 False positive rate: 3% 💡 False negative rate: 0.5% PhysioSign **CE MDR Certified #ECG #AI
Benny Lau tweet media
English
1
4
17
937
Benny Lau
Benny Lau@physiosign·
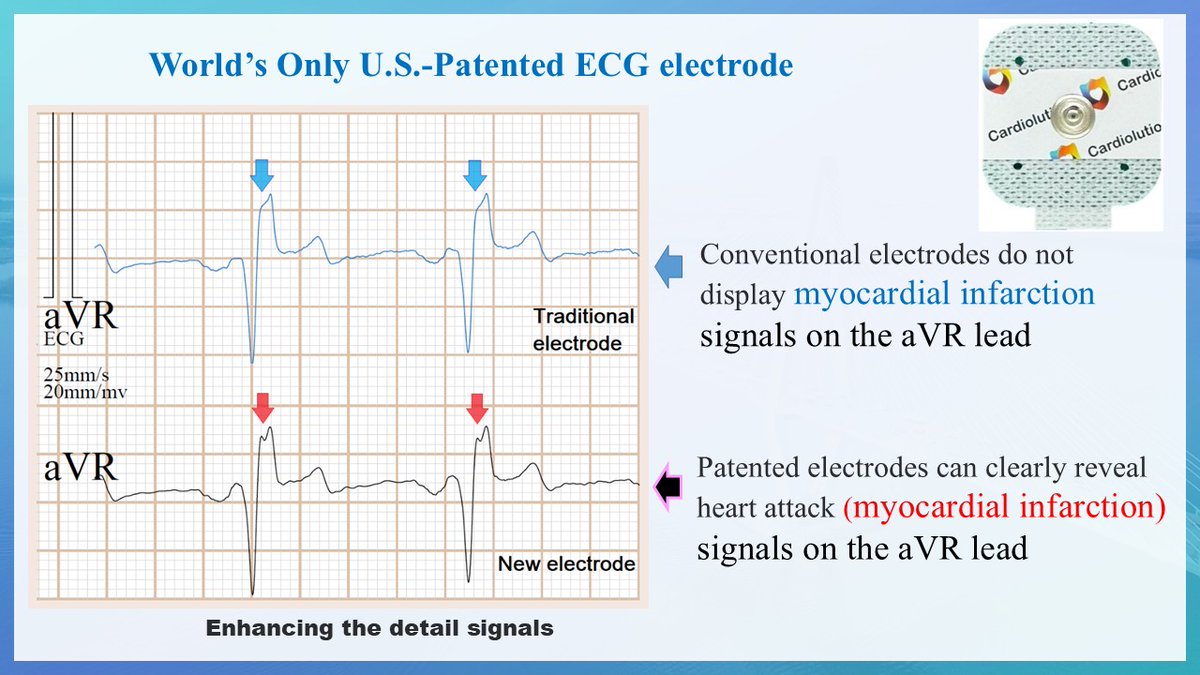
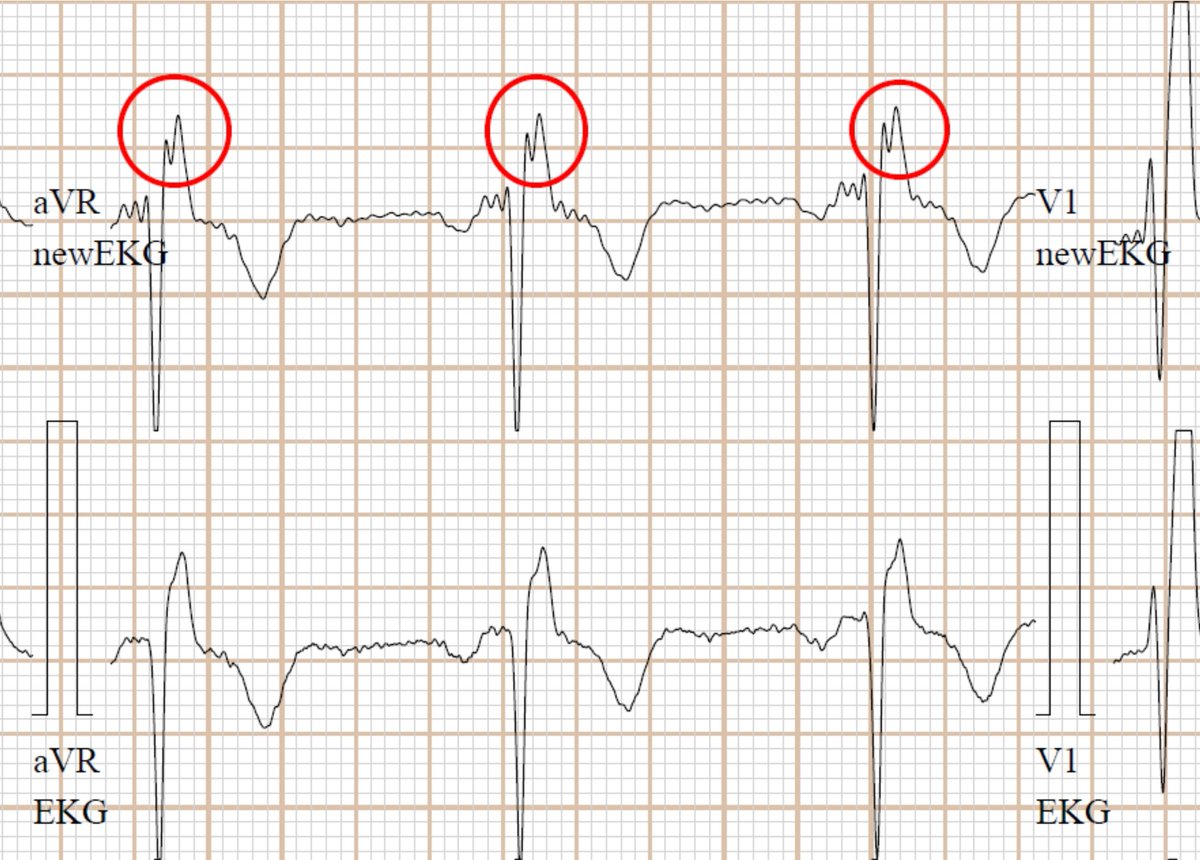
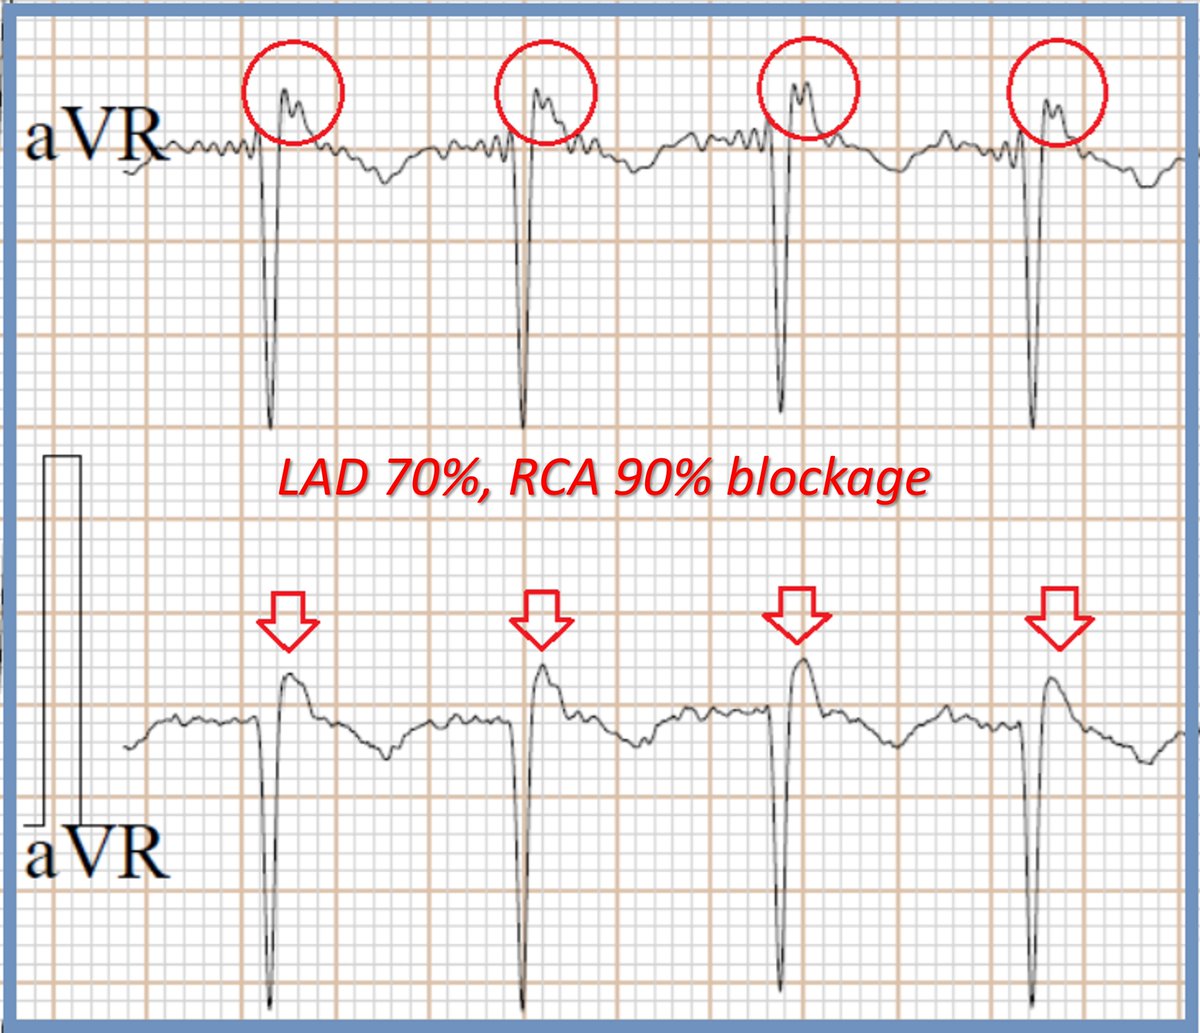
The world’s only U.S.-patented ECG electrode Some people may assume that all ECG machines on the market are similar in quality and disease detection capability. In reality, this is not the case. High-end branded ECG machines generally deliver significantly better image clarity and disease detection rates than low-cost, lower-quality products. This difference primarily stems from superior signal processing technology. Big-brand ECG machines use chips that cost 20 times more than those in budget brands. This is the main reason they can display more detailed signals. This results in a substantial difference in image clarity and detail resolution. Regarding fragmented waves (notching) in the aVR lead, these are only occasionally visible on big-brand ECG machines and are not displayed consistently. Budget ECG machines almost never show them. Our ECG system achieves a 99% display rate for fragmented waves in the aVR lead. This exceptional performance is made possible by our use of the world’s only U.S.-patented ECG electrode, combined with multiple patented signal processing technologies. Our patented electrodes offer excellent resistance to interference, baseline drift, and hair artifacts. Even when used with major-brand ECG machines, they can significantly improve the visibility of fragmented waves in the aVR lead. We not only utilize this patent but have also developed our own exclusive electrode gel formula, which further enhances signal acquisition and anti-interference performance. In addition, our electrodes feature extremely strong adhesion, remaining securely attached even if the patient sweats heavily. They stay reliably in place during 24-hour Holter monitoring as well. Key Features: 1) Strong anti-interference 2) Prevents baseline drift 3) Reduces hair artifacts 4) Super strong adhesion — stays in place even when patients sweat PhysioSign USA
Benny Lau tweet mediaBenny Lau tweet mediaBenny Lau tweet mediaBenny Lau tweet media
English
1
3
25
1.6K
Benny Lau
Benny Lau@physiosign·
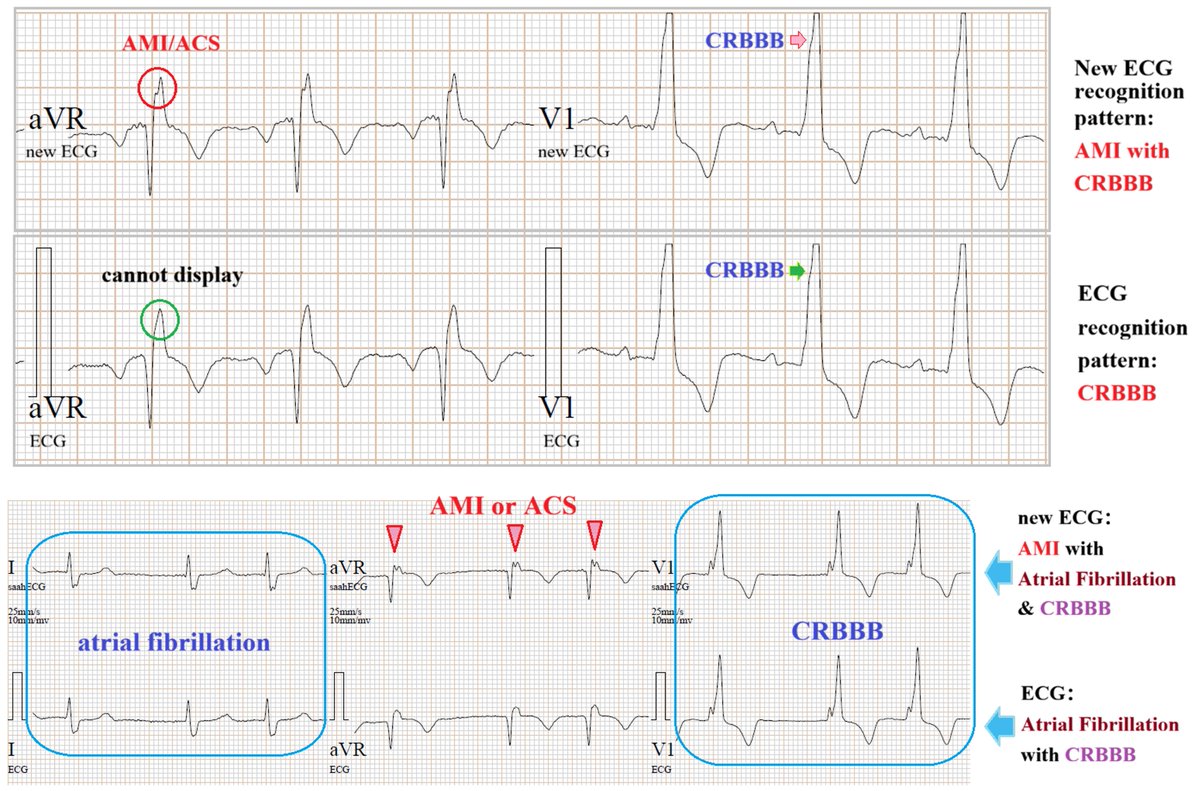
AMI with A-fib and CRBBB What is the difference between the new ECG and the traditional ECG? The biggest difference is in the image details. The details captured by the new ECG precisely represent the original disease foci. More importantly, they provide the natural recording of hidden, tricky, and clinically critical myocardial markers that are often needed. Some experts ask: Why can traditional ECG only show CRBBB but cannot display the fragmented wave signals of myocardial damage? First reason: Traditional ECG is essentially a high-frequency convolution image. It is dominated by 99% ultra-high-frequency signals, so the tiny myocardial membrane potential signals are completely submerged by the high frequencies and cannot be recorded. Second reason: The QRS complex itself is not a sine wave but a pulse wave consisting of ultra-high and extremely high frequencies. Traditional ECG cannot display the extremely low-frequency injury potentials. When AMI or ACS occurs in the posterior wall or right wall, the right-sided conduction pathway is blocked, and it only manifests as a mimic CRBBB (Pseudo-CRBBB). Doctors can apply ECG very precisely in clinical practice. The new ECG delivers results in 10 seconds, with both types of ECG images scanned synchronously. It performs AI-automated mapping of the full dataset (including invasive data), and an automated reading and interpretation system is available according to the doctor’s needs. Figure 1: Traditional ECG shows CRBBB only. New ECG shows AMI with CRBBB. Figure 2: Traditional ECG shows AF with CRBBB. New ECG shows AMI with AF and CRBBB. PhysioSign USA **CE MDR certified **53 US & International patents **Built on 15+ million recordings
Benny Lau tweet media
English
0
5
38
1.2K
Benny Lau
Benny Lau@physiosign·
CAD with Atrial Fibrillation & RBBB Is ECG Useful? Undoubtedly, yes. No instrument can replace it. However, for more than 120 years, the images recorded by conventional ECG have remained unchanged. 99% of them are high-frequency convoluted waveforms.  Coronary Artery Disease (CAD) was discovered in 1973 and officially named by Harvard in 1976. Yet in clinical practice, doctors face enormous challenges. AMI/CAD/ACS accounts for more than 60% of cardiovascular diseases — even higher in some countries. Doctors frequently encounter cases where the ECG clearly shows a CRBBB pattern, but the final diagnosis is CAD, with coronary angiography (CAG) revealing stenosis or occlusion greater than 70%. The issue is not that the ECG image is poor, but that its resolution has been insufficient for over 120 years. The new scientific discipline of “signal processing” — a key technology of the Third Industrial Revolution — only developed after the year 2000. Unfortunately, it has not been applied to traditional ECG image processing. Traditional ECGs do capture all the signals through convolution, but unfortunately, the fine details are not displayed. It is similar to how X-ray and CT images of the same patient contain the same natural anatomical elements, yet reveal different diagnostic information depending on the modality. The same principle applies to traditional ECG versus new-generation ECG — the difference lies in the level of image detail. Please refer to the attached Figure showing ECG images of 4 patients taken before their CAG results. PhysioSign USA
Benny Lau tweet media
English
2
36
158
6.8K
Blue the Helldiver
Blue the Helldiver@BlueHelldiver·
How you know this is AI? POINT 1 - Why are they wearing a plate carrier? And specifically, one on the front designed for human anatomy? (LOL why not add a holding mount for a ceramic / steel rectangles? Especially steel... why not make the casing harder.) POINT 2 - What machine fires 20 bullets when it has accuracy, can count, and doesn't possess fear? Talk about expensive design if real.
Blue the Helldiver tweet media
English
14
1
71
15.2K
SANTINO
SANTINO@TheRealSantino·
BREAKING: China's autonomous "killer robots" are on track to serve its military on the battlefield within two years, setting a course for a new age of AI-powered warfare which one expert called "the greatest danger to the survival of humankind." Remote forms of warfare, from drones to cyberattacks, have played an increasingly central role in this century's theatres of war. Control of the skies with unmanned aerial vehicles has been critical issue in the ongoing war in Ukraine, and last week, the U.S. Department of Defense unveiled a fresh $1 billion investment to upgrade its drone fleet. Several major powers have taken this development a step further, and begun to develop fully autonomous, AI-powered "killer robots" to replace their soldiers on the battlefield. "I would be surprised if we don't see autonomous machines coming out of China within two years," Francis Tusa, a leading defence analyst, told National Security News. He added that China was developing new AI-powered ships, submarines, and aircraft at a "dizzying rate." "They are moving four or five times faster than the States," he warned. China and Russia are already reported to have collaborated on the development of AI-powered autonomous weaponry. Per Newsweek
English
1.8K
1.9K
6.3K
1.5M
Benny Lau
Benny Lau@physiosign·
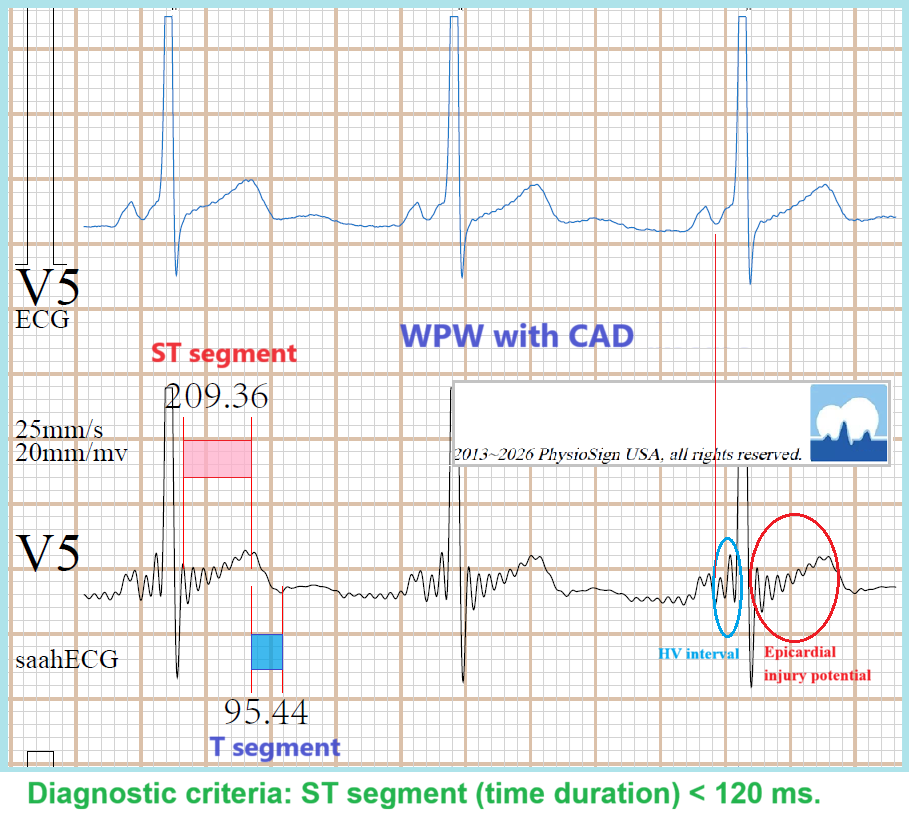
*WPW with CAD* In routine clinical practice, standard electrocardiograms (ECGs) identify common conduction and rhythm abnormalities such as premature beats, atrial fibrillation or flutter, bundle branch blocks, atrioventricular blocks, Wolff-Parkinson-White (WPW) syndrome, tachycardias, and bradycardias. These patterns frequently represent secondary electrical phenomena. Critically, they can obscure the underlying primary pathology: acute coronary syndromes, including ST-elevation myocardial infarction (STEMI), non-ST-elevation myocardial infarction (NSTEMI), and acute coronary syndrome (ACS)—encompassing myocardial infarction and unstable angina. This diagnostic limitation stems from the technical focus of conventional ECG acquisition, which primarily captures high-frequency electrical signals. Since the 1970s, a period marked by the rising prevalence of coronary artery disease, clinicians have faced the persistent challenge that these prominent high-frequency patterns can mask the more subtle, often low-voltage, electrocardiographic signs of acute, evolving, or prior myocardial ischemia and infarction. Example: A 52-year-old man undergoing two ECG synchronization tests prior to angiography. Coronary angiography (CAG) subsequently confirmed the findings, revealing a 95% blockage in the LCx and 65% stenosis with generalized plaque in the RCA. [A] Existing ECG: Only demonstrates the WPW pattern (delta wave), with no clear signs of myocardial infarction or ischemia. [B] new ECG: While this does not alter the standard (ECG) itself, it allows for the recording of detailed local electrical signals. In the atrial area (red circle), the technique clearly delineates the HV interval. A side-by-side comparison reveals that this specific signal is embedded within the Delta wave. This marks the first time in cardiac electrophysiology that the precise local signals folded into the Delta wave—and the reason for its appearance—have been clearly demonstrated. In the ventricular area (blue circle): Reveals epicardial injury currents and allows precise measurement of the ST segment duration (exact time length - ST segment 209.36ms) - ST segment < 120ms**considered the gold standard in textbooks. [C] Back in the 1980s, experts already recognized that the duration of the ST segment (i.e., its time length along the X-axis) is important for diagnosing ischemia — rather than just ST-segment elevation or depression (Y-axis amplitude). Annotation: “S-T interval = ST segment + T wave, but traditional ECGs cannot measure it accurately. PhysioSign USA #Cardiology #ECG
Benny Lau tweet media
English
1
4
20
1.2K
Benny Lau
Benny Lau@physiosign·
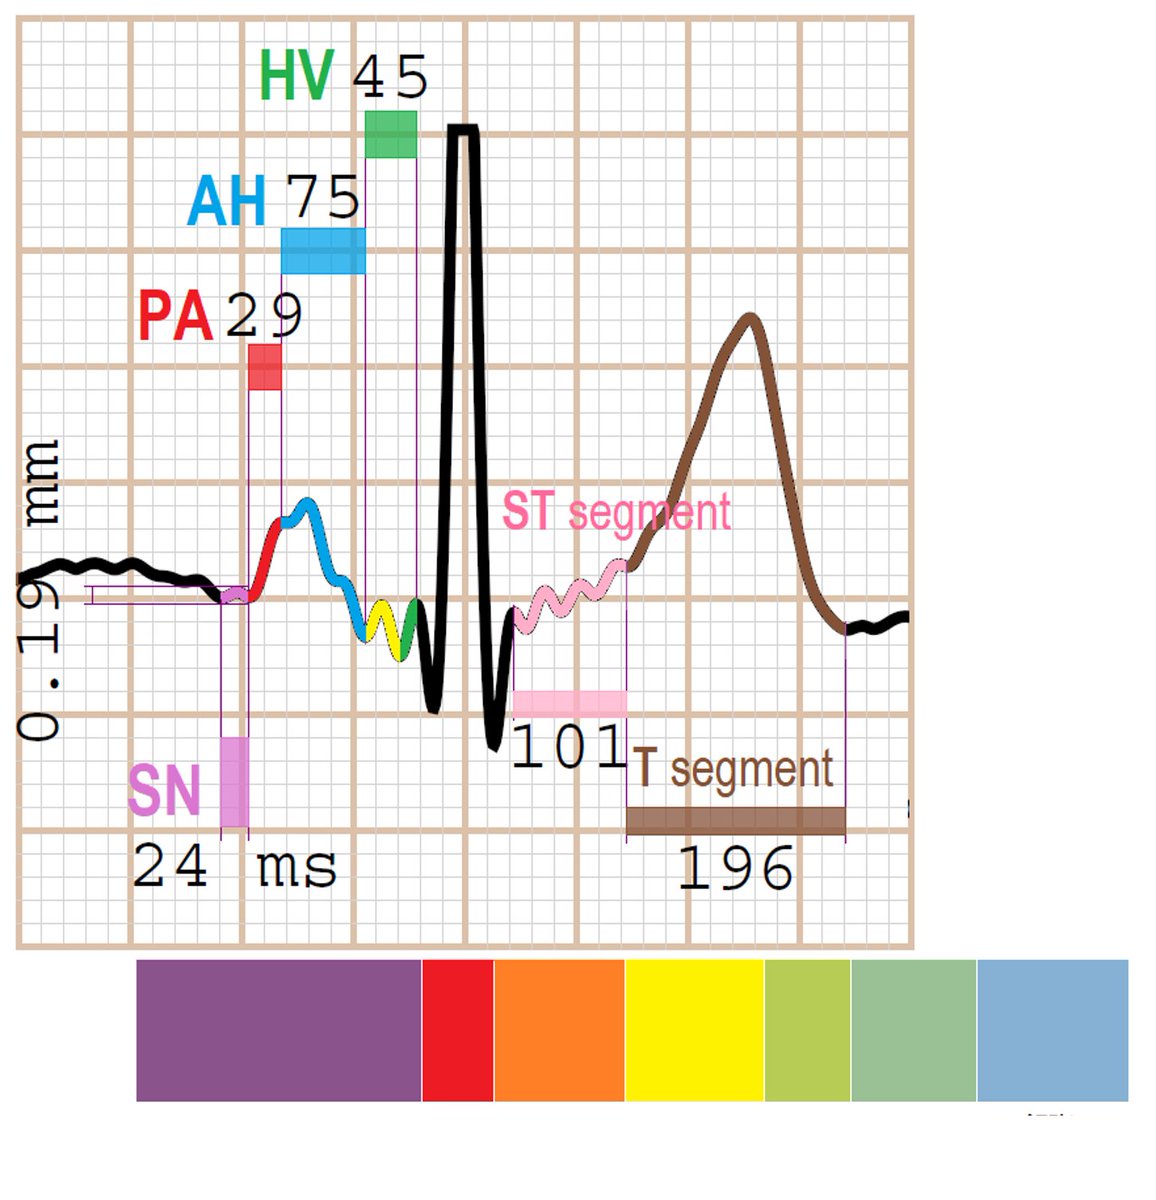
ST segment duration <120 ms (considered the gold standard in textbooks) Since coronary artery disease (CAD) was first identified and named in 1976, it has become the most common cause of heart disease worldwide. However, many cases of CAD do not present with ST-segment elevation. Even after an acute myocardial infarction (AMI), approximately half of non-ST-elevation myocardial infarctions (NSTEMIs) persist without this feature, posing significant challenges for clinicians and highlighting the limitations of conventional ECG. The new ECG technology scans the ST wavelet, enabling it to divide the S-T interval into two distinct segments and measure both the ST segment and T segment (providing precise timing data). This new ECG has undergone animal experiments and testing in MI models, revealing the great significance of this parameter. The combination of data and images allows it to record myocardial standards before a heart attack occurs. This pioneering invention represents one of the most important discoveries of the century and may prove to be the most clinically significant and valuable advancement in cardiac diagnostics. **The most critical factor is the injury current inside the heart, which changes over time. Therefore, changes in duration (timing) typically occur in the early stage, while changes in amplitude are already a sign of more severe late-stage damage.** There’s no need for an entirely new ECG technology—traditional ECG can also detect certain changes. So, which is more important: the early changes or the late-stage sudden events? Of course, the early changes are far more important, because early intervention can prevent progression. PhysioSign USA
Benny Lau tweet media
English
0
0
6
289
Benny Lau
Benny Lau@physiosign·
EpCG was invented in 2017 with the aim of visualizing heart signals. The recorded signal from the initial scan was processed using AI technology to isolate the full frequency spectrum of cardiac activity. The total amplitude and duration of the P-QRS-T waves are consistent with those of conventional ECG. The heart is a living organ that exhibits microelectronic properties. While ordinary cardiac muscle tissue performs mechanical work, specialized tissues play a crucial role in the excitation, pacing, and conduction functions of the heartbeat. Many unresolved mysteries of the heart lie within the ultra-low frequency range, both above and below the axis. Atrial and ventricular repolarization represent the resting phase, when the heart appears to be in a state of dormancy. The overall EpCG image aligns with the anatomical structure of the heart as observed post-dissection. The scientific foundation of EpCG elucidates the enigma of cardiac electrophysiological frequency distribution. Traditional ECG images are represented as line waveforms, predominantly composed of high-frequency components. For over a century, single-line waveforms have been used to diagnose diseases across different time frames. EpCG's full-frequency cardiac images unveil numerous historical mysteries of the heart, demonstrating that conventional ECG primarily displays high-frequency electrical signals. PhysioSign USA
Benny Lau tweet media
English
0
1
5
229
Benny Lau
Benny Lau@physiosign·
Traditional ECG Interpretation in CRBBB: When a complete right bundle branch block (CRBBB) is present, diagnosing an acute myocardial infarction (MI) is often challenging. This is because subtle, low-frequency ischemic changes are typically obscured by the high-amplitude, high-frequency signals associated with the conduction abnormality. new ECG Interpretation: A refined ECG analysis that reveals CRBBB with R-wave peak cracking (also described as notching or fragmentation of the R wave) provides an additional diagnostic clue. This specific finding indicates underlying ischemia or infarction and is particularly suggestive of left main coronary artery disease or a right posterior myocardial infarction. ***Observations in Lead aVR: In lead aVR, injury currents can cause fragmentation of R-wave peaks, primarily associated with proximal lesions in the left main (LM) coronary artery, right coronary artery (RCA), or left anterior descending (LAD) artery. A notched R-wave peak in lead aVR is a recognized marker of myocardial infarction (MI), though it remains undetectable on standard electrocardiograms (ECGs). Extensive research by international experts over the past century supports this finding. Unlike conventional ECGs, the innovative saahECG technology clearly visualizes this feature. Although notched R-waves are documented in medical literature, traditional ECG systems lack the resolution to capture them effectively. PhysioSign USA
Benny Lau tweet media
English
0
1
5
436
Benny Lau
Benny Lau@physiosign·
I would like to analyze the invention technology of our "Second Generation ECG". They are different. 【a】 saahECG is exactly the same as the traditional ECG in terms of high-frequency components, but it also incorporates ultra-low-frequency components, which are essentially the basic ion signal images. There was no change in the ECG itself—just more detailed images of the ionic signals. This is the first revolution since the existence of ECG. The traditional ECG is version 1.0, while the new ECG is version 2.0. 【b】 EpCG is completely different from the traditional ECG. It presents in three dimensions but is displayed in two dimensions. It has completely revolutionized the traditional ECG. It is a fully visual image, divided by frequency, dimension, and chronological layers. It will become the 3.0 version of ECG in the future. It will be particularly liked by surgeons who perform invasive procedures. In terms of reading, analysis, identification, and judgment, the new ECG (saahECG) requires the foundation of traditional ECG (deep knowledge required). PhysioSign USA
Benny Lau tweet media
English
0
0
5
189
Benny Lau
Benny Lau@physiosign·
EpCG - Electrophysiocardiogram Three types of ECGs were simultaneously recorded from healthy individuals (at 50 mm/s speed and 20 mm/mV amplitude) This illustrates the conjecture proposed by Brian Hoffman in 1964. The schematic diagram shows the hypothesized path of the heart's specialized conduction fibers during each heartbeat. Seven vertical lines are numbered: [1] Start of the beat pacing. [2] Conduction to the atrium. [3], [4], and [5] Represent the AVN (a sum of three anatomical regions) traversing the entire atrium. [6] Passage through the bundle of His. [7] The atrioventricular bundle ends and divides into left and right bundle branches. Following [7], the symbol "P" and a dashed line represent the Purkinje fibers, which go straight to the ventricle. The SAN is located in front of [1]. Bottom Section: The new ECG demonstrates that each local wavelet matches Hoffman's predictions. A critical point is that the recording accuracy reaches 99%. Whenever a traditional ECG can be recorded, the new ECG can also be recorded, showing consistent time courses and amplitudes; this aligns with the universality theorem. ***EpCG proved that Hoffman's 1964 conjecture regarding the specialized cardiac conduction system was correct. PhysioSign USA
Benny Lau tweet media
English
0
0
4
243
Benny Lau
Benny Lau@physiosign·
Revealing the Clinical Application of CLBBB Masking AMI In cardiology, the modified Sgarbossa criteria are used to diagnose acute myocardial infarction (AMI) in the presence of complete left bundle branch block (CLBBB). However, accurately identifying the J-point for measuring ST elevation is challenging for most clinicians. Observations in Lead aVR: In lead aVR, injury currents may cause fragmentation of R-wave peaks, primarily associated with proximal lesions in the left main (LM) coronary artery, right coronary artery (RCA), or left anterior descending (LAD) artery. A notched R-wave peak in lead aVR is a recognized marker of myocardial infarction (MI), though it remains undetectable on standard electrocardiograms (ECGs). Extensive research by international experts over the past century supports this finding. Unlike conventional ECGs, our innovative ECG technology clearly visualizes this feature. Although notched R-waves are documented in medical literature, traditional ECG systems lack the resolution to capture them effectively. J-Point Measurement: Traditional ECGs struggle to accurately measure the J-point because it lies on a curved arc, making precise identification difficult. new ECG technology identifies a small wave within this arc, with the peak of the first wave precisely marking the J-point. This enables accurate measurement, unlike the rough estimates used in traditional ECGs, such as those based on the modified Sgarbossa criteria for detecting MI in the presence of CLBBB. The Sgarbossa criteria rely on experience-based approximations due to the absence of a clear measurement point. new ECG addresses this limitation by providing precise J-point measurements, improving diagnostic accuracy. **the R-wave peak in traditional ECG is sharp (even with injury currents, it remains sharp because ECG captures high-frequency signals from the heart’s surface cells). However, the new ECG imaging reflects ionic signals, which can display myocardial injury currents. PhysioSign USA
Benny Lau tweet mediaBenny Lau tweet media
English
1
17
52
5.4K
Benny Lau
Benny Lau@physiosign·
EpCG - Electrophysiocardiogram Comparison Before and After Radiofrequency Ablation **Dual AVN pathways complicated by AVN reentrant tachycardia. **The pink arrow indicates the bundle of His, which normalized following radiofrequency ablation (RFA). **The white arrow shows that the retrograde potential is located near the endocardium and originates at the AVN site. The AVN reentry potential is clearly visible, with the atrial muscle potential morphology exhibiting a leftward rotation trend, characteristic of a typical reentry potential. PhysioSign USA
Benny Lau tweet media
English
1
0
3
339
Benny Lau
Benny Lau@physiosign·
**Reveal the Clinical Application of CRBBB Masking AMI** The presence of complete right bundle branch block (CRBBB) can obscure the electrocardiographic diagnosis of acute myocardial infarction (AMI). This masking effect complicates clinical evaluation, as CRBBB alters typical ECG patterns, potentially concealing critical indicators of AMI. Understanding this interaction is essential for accurate diagnosis and timely intervention. ECG: This represents a typical CRBBB (Complete Right Bundle Branch Block) recognition pattern. No additional information suggests alternative conditions. new ECG: Qualitative: The aVR lead shows an R-wave cracking duration or notch with approximately 89% correlation to left main (LM) or right posterior wall ischemia, potentially due to stenosis or blockage of the left circumflex (LCx), right coronary artery (RCA), or left main (LM) artery. A history of prior acute myocardial infarction (AMI) may also be evident. Quantitative: If the aVR lead exhibits an R-wave peak widened beyond 60 ms with cracking, it serves as a marker of coronary artery disease (CAD), acute myocardial infarction (AMI), or acute coronary syndrome (ACS). **This individual has confirmed CAD with 90% LM stenosis and 80% RCA blockage** PhysioSign USA
Benny Lau tweet media
English
2
11
57
2.8K