plot

655 posts

plot banner
plot

plot

@plot_this

Nice and simple charts. Created by @illustratethis. Contact [email protected]

Ireland Katılım Mart 2021
3 Takip Edilen1K Takipçiler
plot
plot@plot_this·
Some more history on the "What religion do you belong to?" question...
plot tweet media
English
0
1
2
0
plot
plot@plot_this·
NI Census: Released within last few minutes: Q. What religion were you brought up in? ➡️45.7% Catholic ➡️43.5% Protestant/Other Christian ➡️10.8% Other (Inc None)
plot tweet media
English
2
4
4
0
RTÉ News
RTÉ News@rtenews·
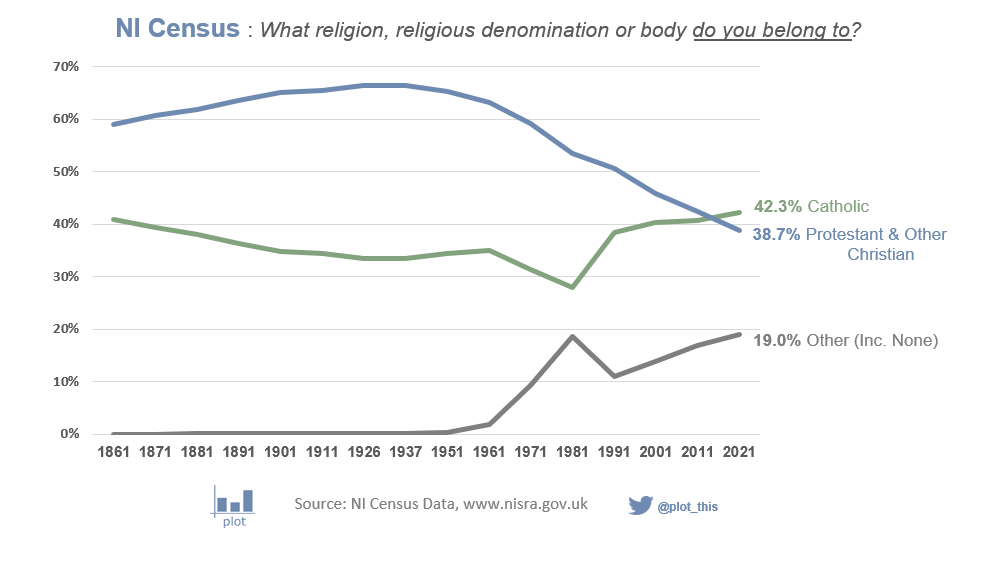
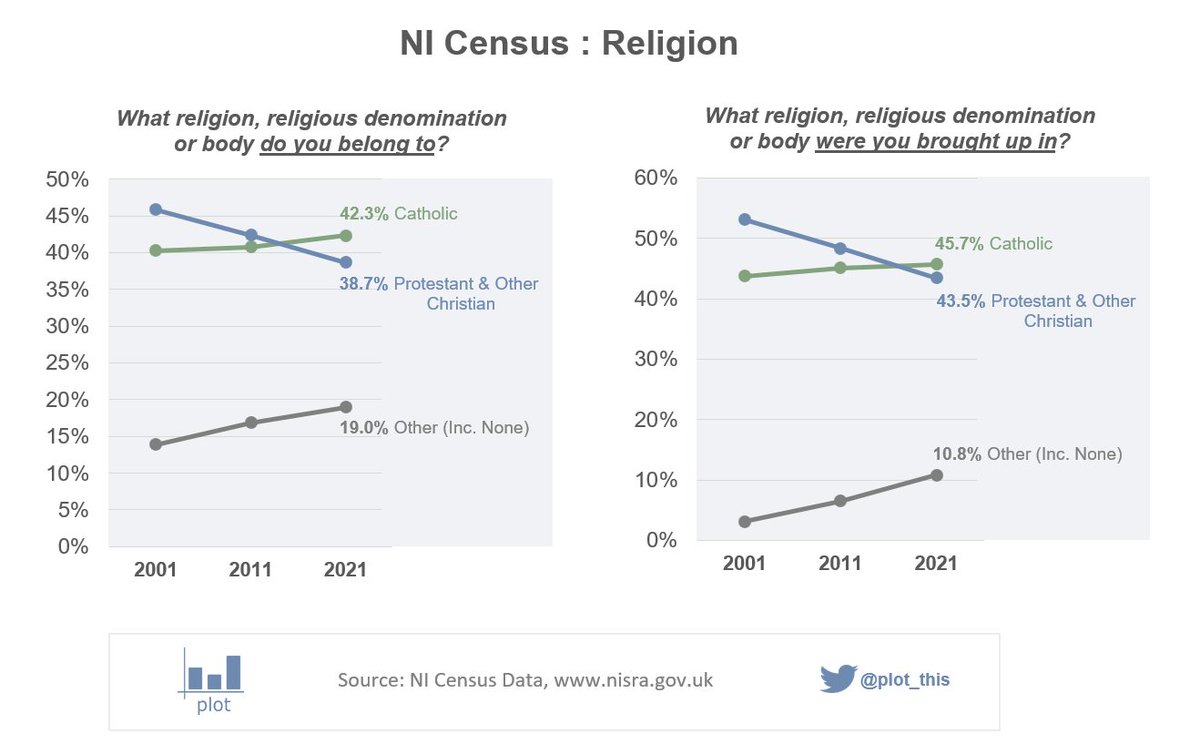
More people in Northern Ireland are Catholic than Protestant for the first time in its 101-year history, Census data shows rte.ie/news/2022/0922…
English
58
71
447
0
Katy Hayward
Katy Hayward@hayward_katy·
The 90 MLAs in the new @niassembly 🥁 Want a new #Executive formed right away: Yes 63 No 27 
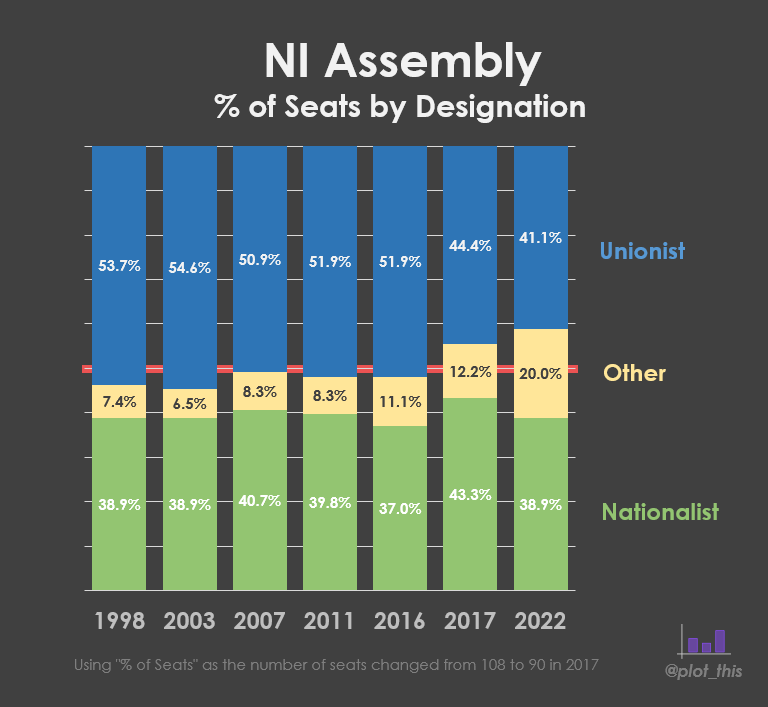
Political #designation: Unionist 37 Nationalist 35 Other 18 On the #Protocol: Implement, with agreed adjustments 54 Find an alternative 36 B/#GFA & StAA Pro-Agmt 89 Anti-Agmt 1 #AE22
English
6
83
220
0
plot
plot@plot_this·
The rise of the centre ground…
plot tweet media
English
4
12
50
0
plot retweetledi
illustrate this
illustrate this@illustratethis·
☘️Happy St. Patrick's Day☘️
English
1
11
31
0
plot
plot@plot_this·
Fri 21st Jan - Rate per 100k people
plot tweet media
English
0
0
2
0
plot
plot@plot_this·
Fri 21st Jan - Rate per 100k people over the last 5 weeks.
plot tweet media
English
1
1
5
0
plot
plot@plot_this·
Re the fall in NI numbers - just highlighting this again as the likely explanation...
plot tweet media
English
1
0
1
0
plot
plot@plot_this·
Thu 13th Jan - Rate per 100k people over the last 5 weeks.
plot tweet media
English
2
1
3
0
plot
plot@plot_this·
Thu 13th Jan - Rate per 100k people
plot tweet media
English
0
1
1
0
plot
plot@plot_this·
Wed 12th Jan - Rate per 100k people
plot tweet media
English
0
0
3
0
plot
plot@plot_this·
Wed 12th Jan - Rate per 100k people over the last 5 weeks.
plot tweet media
English
1
0
8
0
plot
plot@plot_this·
Please note below - which is likely to be the primary reason behind the dip in NI numbers.
plot tweet media
English
0
3
3
0
plot
plot@plot_this·
Tue 11th Jan - Rate per 100k people over the last 5 weeks.
plot tweet media
English
2
1
4
0
plot
plot@plot_this·
Tue 11th Jan - Rate per 100k people
plot tweet media
English
0
0
3
0
plot
plot@plot_this·
@marksugruek Hi Mark - below is from the BBC...
plot tweet media
English
0
1
2
0
plot
plot@plot_this·
Mon 10th Jan - Rate per 100k people
plot tweet media
English
0
2
5
0
plot
plot@plot_this·
Mon 10th Jan - Rate per 100k people over the last 5 weeks.
plot tweet media
English
1
5
9
0