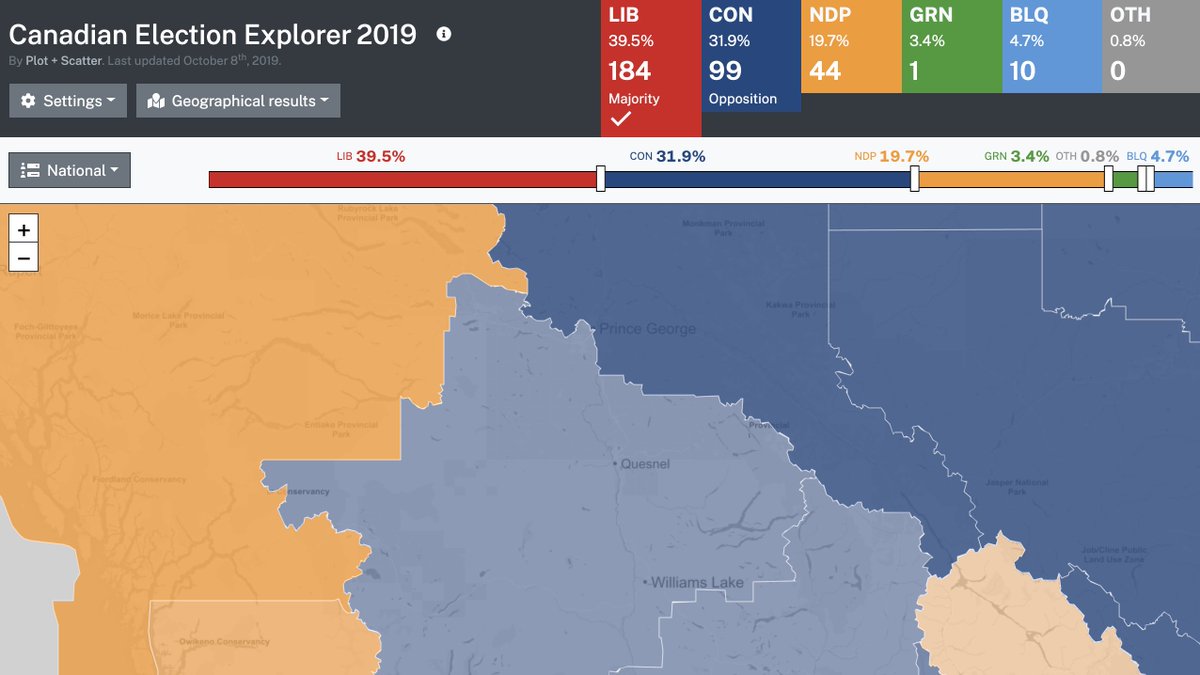
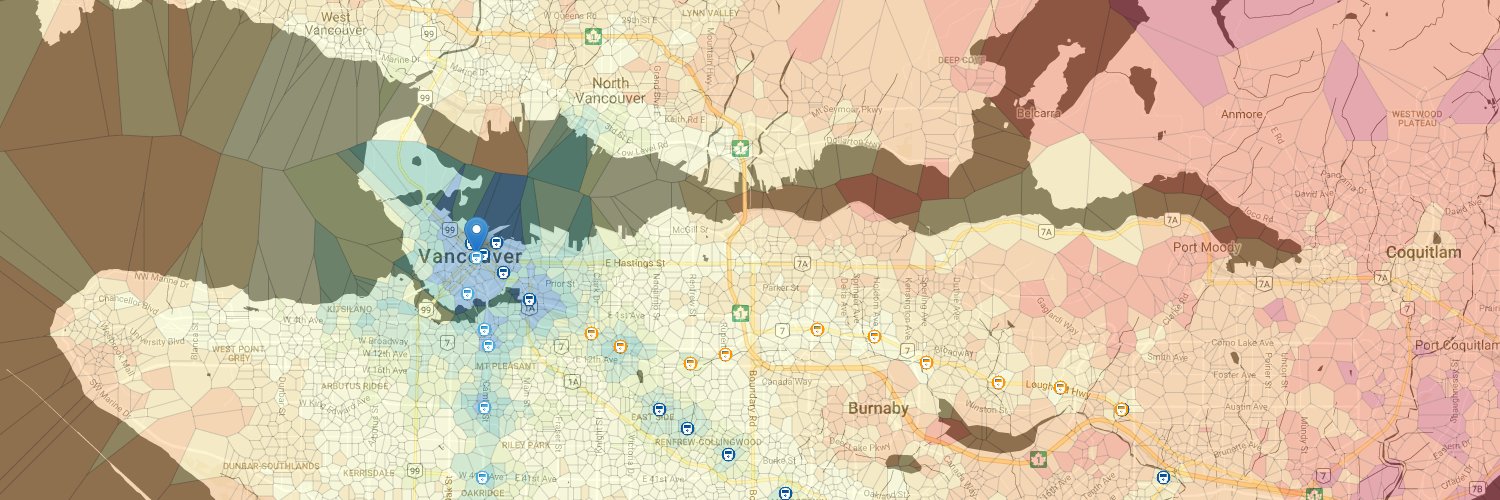
Plot + Scatter

386 posts

Plot + Scatter banner
Plot + Scatter

Plot + Scatter

@plotandscatter

Data analysis, UX, & UI. We transform data for human consumption. [email protected]

Vancouver, BC Katılım Ekim 2014
159 Takip Edilen183 Takipçiler
Plot + Scatter
Plot + Scatter@plotandscatter·
@PeterVogel Thanks, Peter! A couple more election-related visualizations in the pipeline…
Downtown, Vancouver 🇨🇦 English
0
0
0
0
Plot + Scatter
Plot + Scatter@plotandscatter·
Not bad for a simple model. Hope to expand on this, including comparing with predictions based on last-available *polling* (as opposed to *actual* results), later in the week.
Downtown, Vancouver 🇨🇦 English
0
0
0
0
Plot + Scatter
Plot + Scatter@plotandscatter·
On a regional basis, the model correctly predicted ridings as follows: Atlantic 25/32 (78%) Quebec 66/78 (85%) Ontario 111/121 (92%) Prairies 25/28 (89%) Alberta 34/34 (100%) British C. 38/42 (90%) Territories 2/3 (67%)
Downtown, Vancouver 🇨🇦 English
1
0
0
0
Plot + Scatter
Plot + Scatter@plotandscatter·
How effective is a regionally-weighted swing model (of the kind used in our app at plotandscatter.com/canada-electio…) at predicting election results? Here are the preliminary findings based on this week’s election.
Downtown, Vancouver 🇨🇦 English
2
1
0
0
Plot + Scatter
Plot + Scatter@plotandscatter·
(The reason for this is that the regionally-weighted swing model distributes that shift most heavily in areas the Conservatives were already strong in, i.e. AB / SK.)
Downtown, Vancouver 🇨🇦 English
0
0
0
0
Plot + Scatter
Plot + Scatter@plotandscatter·
…(i.e. Liberals at 31.0%), they would only have had ~50% chance of winning a minority. Again, this is assuming a regionally-weighted swing, usual disclaimers apply, etc, etc. But still.
Downtown, Vancouver 🇨🇦 English
1
0
0
0
Plot + Scatter
Plot + Scatter@plotandscatter·
One interesting finding: a swing model (using regional weights from last night) suggests that the Liberal vote was so efficient that even had the Conservatives won 36.5% of the vote *exclusively at the expense of the Liberals*…
Downtown, Vancouver 🇨🇦 English
1
0
0
0
Plot + Scatter
Plot + Scatter@plotandscatter·
For posterity: our simple regionally-weighted election app (plotandscatter.com/canada-electio…), using CBC Poll Tracker regional values, gives L144 • C119 • N42 • BLQ 31 • G2. Only a few hours till we know for sure…
Plot + Scatter tweet media
Downtown, Vancouver 🇨🇦 English
0
1
0
0
Plot + Scatter
Plot + Scatter@plotandscatter·
A three-party coalition would seem even more unstable than a two-party one. If (and it’s a big “if”!) the actual results on Monday follow the polls as they are now, a return trip to the ballot box in the near future seems likely. #cdnpoli #elxn43
Downtown, Vancouver 🇨🇦 English
0
0
0
0
Plot + Scatter
Plot + Scatter@plotandscatter·
At least with these figures, the number of available two-party coalitions is relatively low, reflecting just how fractured public opinion appears to be. CON + NDP seems statistically likely, but is perhaps politically less so. LIB + NDP only works ~56% of the time.
Downtown, Vancouver 🇨🇦 English
1
0
0
0
Plot + Scatter
Plot + Scatter@plotandscatter·
Lots of talk of minority governments lately! The Insights view, newly added to our tool (plotandscatter.com/canada-electio…), simulates elections and shows statistically likely outcomes. A large variety of possible minority coalitions, given current polling numbers. #cdnpoli #elxn43
Plot + Scatter tweet media
Downtown, Vancouver 🇨🇦 English
1
1
1
0