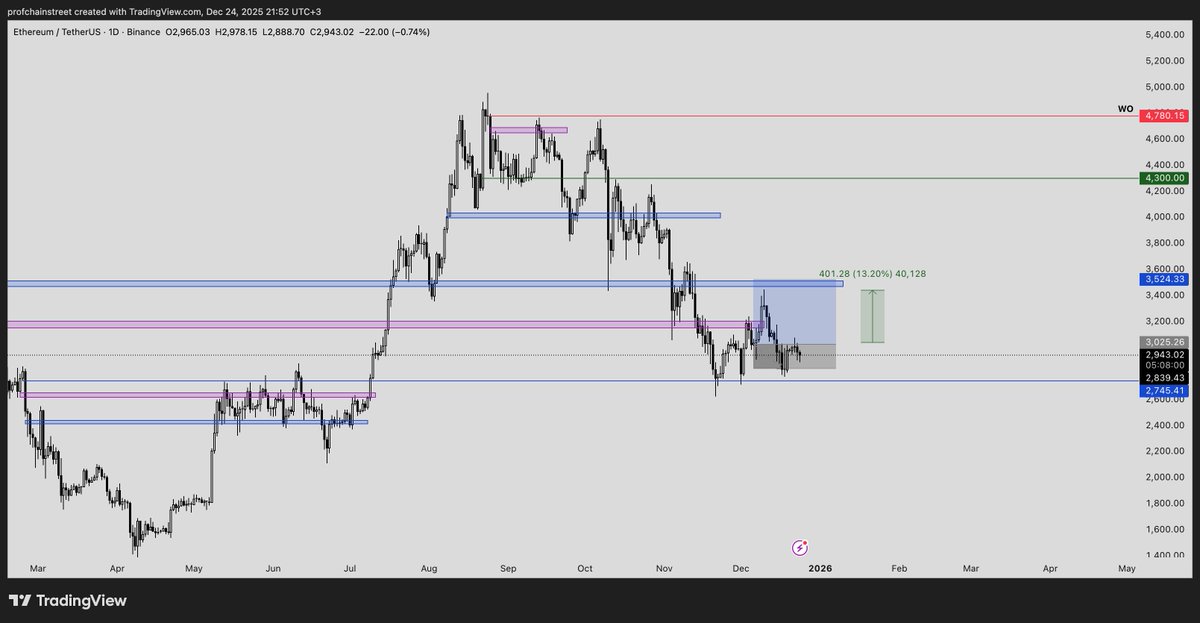
Professor Chain Street

315 posts

Professor Chain Street banner
Professor Chain Street

Professor Chain Street

@profchainstreet

I read the charts, predict the moves, and let the data speak. 🚀📊 Does not constitute financial advice. TG: https://t.co/JSqvmrBmvM Powered by @Edu3Labs

Katılım Nisan 2024
2 Takip Edilen1.6K Takipçiler
Professor Chain Street
Professor Chain Street@profchainstreet·
$BTC 1D Update Price action reached the anticipated $95,264 zone, where it acted as resistance. This move may represent a liquidity sweep on a chart that maintains a bearish structure, occurring prior to a potential continuation to the downside. Other support and resistance levels can be observed directly on the chart.
Professor Chain Street tweet media
Professor Chain Street@profchainstreet

$BTC 1D Update As the price failed to break above the $95,200 level, it was unable to gain sufficient volume. Consequently, it may show a tendency to move toward the buyer cluster located around the $72,270 level.

English
1
1
1
34
Professor Chain Street
Professor Chain Street@profchainstreet·
$BNB 4H Update As stated in the previous analysis, the $805 level was not broken to the downside, and the blue box acted as resistance in the short term. As long as the structural setup does not violate the blue box, the probability of price reaching the final target at $979 remains valid. 💪💪
Professor Chain Street tweet media
Professor Chain Street@profchainstreet

$BNB 4H Update As long as the $805 support level is not broken to the downside, the $979 area will continue to be monitored as the next target. In the short term, the blue zone may act as resistance.

English
1
1
1
30
Professor Chain Street
Professor Chain Street@profchainstreet·
$SOL 1D Update On the left side, the resistance at the $145 level has remained active for an extended period. To the downside, $112 can be considered a support level, while $164 stands out as a resistance area to the upside.
Professor Chain Street tweet media
Professor Chain Street@profchainstreet

$SOL 1D Update The 145 $ level has acted effectively on three occasions, with the price continuing to trend downward from this area. Accordingly, my expectation toward the 112 $ region remains intact. However, should the price break above the 145 $ level to the upside, levels around 180 $ may come under observation.

English
1
1
1
33
Professor Chain Street
Professor Chain Street@profchainstreet·
💰A notable data point has emerged on Ethereum: The ETH staking entry queue has surpassed the exit (unstaking) queue for the first time in six months. Historically, this structure preceded ETH rallies of 90% and 126%. With the technical outlook remaining constructive above $2,750, a similar setup brings the $5,000 target for 2026 back into focus. #Ethereum #ETH #Staking #CryptoMarkets #OnChainData
Professor Chain Street tweet media
English
1
1
1
45
Professor Chain Street
Professor Chain Street@profchainstreet·
$AAVE 1D Update The support level at $145 mentioned in the previous analysis is currently holding. However, the downside momentum appears likely to continue. Accordingly, within a hypothetical short scenario, a position has been structured with take profit (TP) set at the $115 area following a downside break below the $145 level.
Professor Chain Street tweet media
Professor Chain Street@profchainstreet

$AAVE 1D Update Following the loss of the 145 $ support level, the price retested this area as resistance and continued its downward movement. Unless the price reclaims the 145 $ zone with a sustained breakout, the next probable support area is assessed around the 112 $ level.

English
1
1
1
38
Professor Chain Street
Professor Chain Street@profchainstreet·
$BTC 1D Update As the price failed to break above the $95,200 level, it was unable to gain sufficient volume. Consequently, it may show a tendency to move toward the buyer cluster located around the $72,270 level.
Professor Chain Street tweet media
Professor Chain Street@profchainstreet

$BTC 1D Update After declining to the 80,600 $ area, the price has begun to make upward corrections. Currently trading around 92,487 $, any downside pullback may present a buying opportunity targeting a potential move toward 98,000 $.

English
0
0
0
65
Professor Chain Street
Professor Chain Street@profchainstreet·
$SOL 1D Update The 145 $ level has acted effectively on three occasions, with the price continuing to trend downward from this area. Accordingly, my expectation toward the 112 $ region remains intact. However, should the price break above the 145 $ level to the upside, levels around 180 $ may come under observation.
Professor Chain Street tweet media
Professor Chain Street@profchainstreet

$SOL 1D Update Following the loss of the 145 $ support level, the price retested this area as resistance and continued its downward move. If the price fails to reclaim the 145 $ zone to the upside, the next expected support area is around 112 $.

English
1
1
1
107
Professor Chain Street
Professor Chain Street@profchainstreet·
$BTC Dominance Update Will altcoins recover? On the dominance side, the purple zone around the 65% level has behaved as anticipated and has shown strong respect. Similarly, the 54% area remains under close observation. At present, the chart has been rejected from the yellow zone and appears to be forming a structure that may target the blue zone to the downside. If the decline gains volume, a relative relief across altcoins could be expected.
Professor Chain Street tweet media
Professor Chain Street@profchainstreet

#BTC Dominance Update Is a relief in the altcoin market approaching? My dominance prediction played out perfectly rejected from 60% and pulled back. Unless the purple zone breaks upwards, the downtrend continues. Altcoins might be gearing up for a breather. But is this just relief or the early signs of a 2025 altseason?

English
1
0
2
52
Professor Chain Street
Professor Chain Street@profchainstreet·
$ETHFI 1D Update The price appears to have recently shown a reaction of approximately 27% from the referenced blue zone. In the medium term, the blue zone around the 0.97 $ level is expected to act as resistance. Accordingly, an additional upward move of roughly 17% from the current area remains a plausible scenario.
Professor Chain Street tweet media
Professor Chain Street@profchainstreet

$ETHFI 1D Update The resistance level functioned effectively and pushed the price below $0.73. At present, the blue zone is acting as a resistance area. If the price breaks upward again, the target region is expected to be around the $1 level.

English
1
1
2
65
Professor Chain Street
Professor Chain Street@profchainstreet·
$AAVE 1D Update Following the loss of the 145 $ support level, the price retested this area as resistance and continued its downward movement. Unless the price reclaims the 145 $ zone with a sustained breakout, the next probable support area is assessed around the 112 $ level.
Professor Chain Street tweet media
Professor Chain Street@profchainstreet

#AAVE 1D Update A highly efficient analysis once again. Following the circular markers on the chart clearly shows how effectively the support and resistance levels are functioning. 😎 The loss of the blue zone around $150 could pull the price down toward the $115 range. On the other hand, you can monitor the resistances directly on the chart (blue zones).

English
1
1
2
85
Professor Chain Street
Professor Chain Street@profchainstreet·
$BNB 4H Update After the blue zone held the price effectively for a period, a downside breakout occurred and the price gained support at the 805 $ level. The second low formed in this area does not fall below the previous one, which can be interpreted as an early sign of a potential bullish reversal. However, confirmation of this scenario requires an upside break of the 905 $ level. Current support and resistance zones can be identified using the levels shown on the chart.
Professor Chain Street tweet media
Professor Chain Street@profchainstreet

$BNB 4H Update Following the loss of the $879 zone, the price found support at the blue box and initiated a corrective move. To discuss potential bullish scenarios, the price needs to reclaim the purple dashed line region. The current resistance levels are identified as the green and purple dashed lines, while the blue box serves as the support area.

English
1
1
1
135
Professor Chain Street
Professor Chain Street@profchainstreet·
$SOL 1D Update Following the loss of the 145 $ support level, the price retested this area as resistance and continued its downward move. If the price fails to reclaim the 145 $ zone to the upside, the next expected support area is around 112 $.
Professor Chain Street tweet media
Professor Chain Street@profchainstreet

$SOL 1D Update Following the loss of the green zone, the price faced rejection around the 145 $ level and gained approximately 17% support from the anticipated demand area. The first resistance can be identified as the green zone, which previously acted as support.

English
1
1
1
170
Professor Chain Street
Professor Chain Street@profchainstreet·
$ETHFI 1D Update The resistance level functioned effectively and pushed the price below $0.73. At present, the blue zone is acting as a resistance area. If the price breaks upward again, the target region is expected to be around the $1 level.
Professor Chain Street tweet media
Professor Chain Street@profchainstreet

$ETHFI 4H Update The loss within the blue zone was absorbed precisely around the 0.70 region, which subsequently pushed the price upward by approximately 18%.💰 At this stage, the initial resistance area is expected to form near the 0.96 level, corresponding to the blue zone.

English
1
1
1
92
Professor Chain Street
Professor Chain Street@profchainstreet·
#AAVE 1D Update A highly efficient analysis once again. Following the circular markers on the chart clearly shows how effectively the support and resistance levels are functioning. 😎 The loss of the blue zone around $150 could pull the price down toward the $115 range. On the other hand, you can monitor the resistances directly on the chart (blue zones).
Professor Chain Street tweet media
Professor Chain Street@profchainstreet

$AAVE 1D Update As observed in the previous update, the anticipated downside movement has materialized, with the price finding support at the lower blue zone. The current zone is acting as support; however, a breakdown below this level could lead the price toward the $152 range.

English
1
1
1
84