
Richard Khoury
173 posts


Richard Khoury
@rgkhoury
Rendering engineer @ SHGames. Views are my own.
Sydney, New South Wales Katılım Mart 2017
138 Takip Edilen63 Takipçiler

My hometown Phillies: from starting the season 21-29 to 6th seed in the playoffs to NLCS champs and going to the World Series.
How can you not be romantic about baseball?
English
@dukope Me and my wife played Obra Dinn together and loved it! With this recommendation it's an instant sale from me. 🎉
English

Been looking forward to this one for a while. If you liked Obra Dinn I'm pretty sure you'll like Golden Idol too.
The RISE of the Golden Idol@ColorGray7
The Case of the Golden Idol is OUT NOW!🔪 🕵️♂️Buy now on Steam🔎👉bit.ly/3Cyn8jf Channel your inner detective by solving a series of gruesome murders in 18th Century England.
English

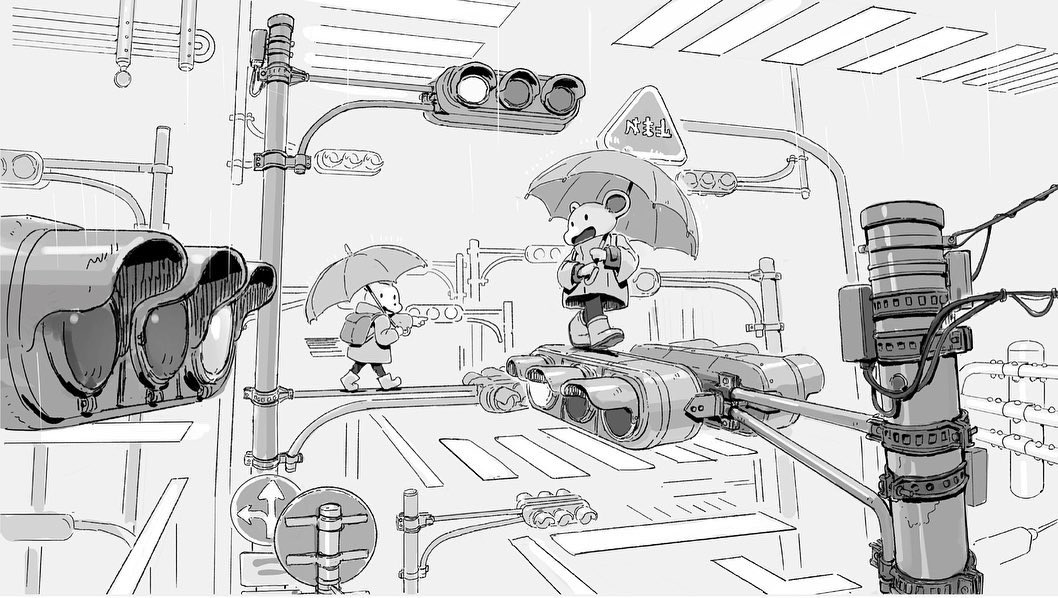
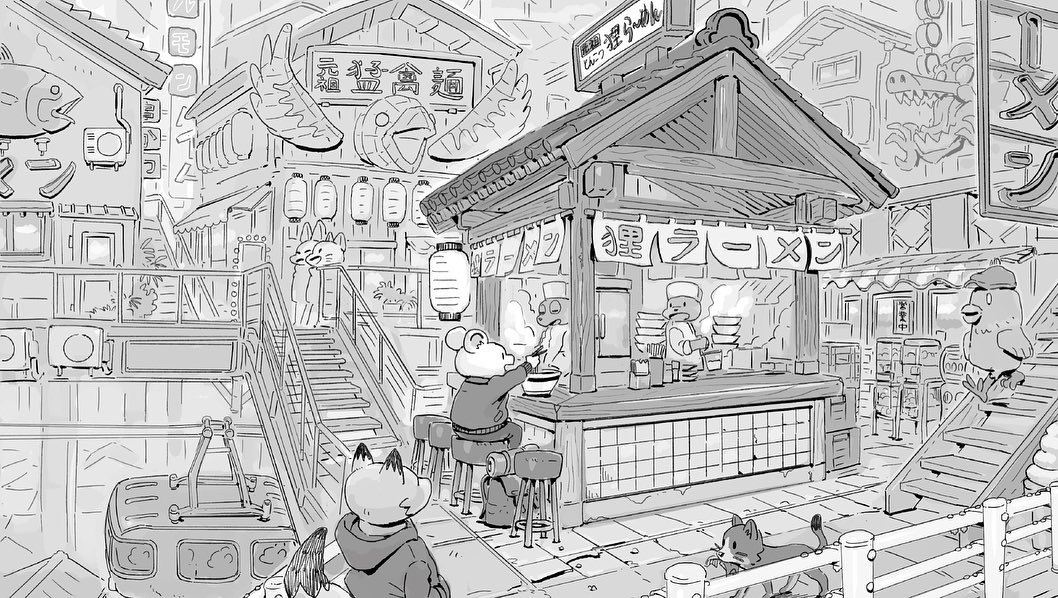
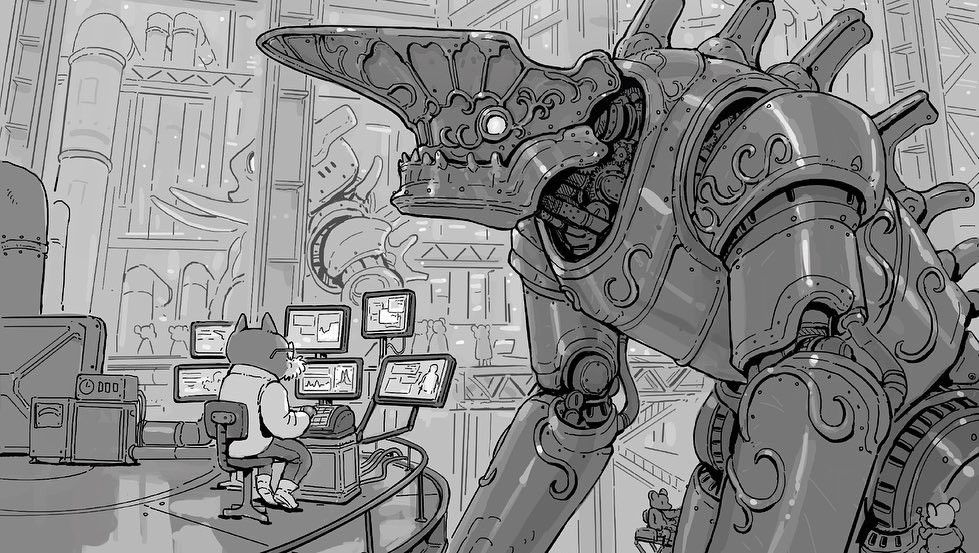
I made my first 100 page art book for Lightbox expo. I’m at table 224 with Minako Tomigahara. See you tomorrow! ライトボックスエクスポ用に初めて本を作りました。明日からよろしくお願いします。
日本語
@timmisiak Awesome, thanks for that. I'll send you an email now but I'm happy to keep using the Feedback Hub if that helps with the scaling (I have a couple of items there already but when there's no comments or way to track activity it's hard to know if it's going anywhere).
English

@rgkhoury You can share them with me on twitter or email me at Microsoft. (Email address is tmisiak).
There are folks on my team thinking about how to manage feedback better. We use email internally, but it's hard to scale that up.
English
What's the best way to discuss WinDbgX usability/issues? A lot of what I may be experiencing might just be something I'm dong incorrectly so a conversation in something like Slack/Discord or similar would be so nice. Do these chat rooms exist?
@timmisiak
English
I've used Microsoft's Feedback Hub too but it's hard to know if anyone in the dev team sees these.
English
@timmisiak @yarden_shafir Ah, I didn't know this was in the Preview version too! I've only known this in the old UI, where you could right-click the Command window title bar and manipulate selection colouring there.
Is there documentation for this and more goodies like it for WinDbg Preview?
English
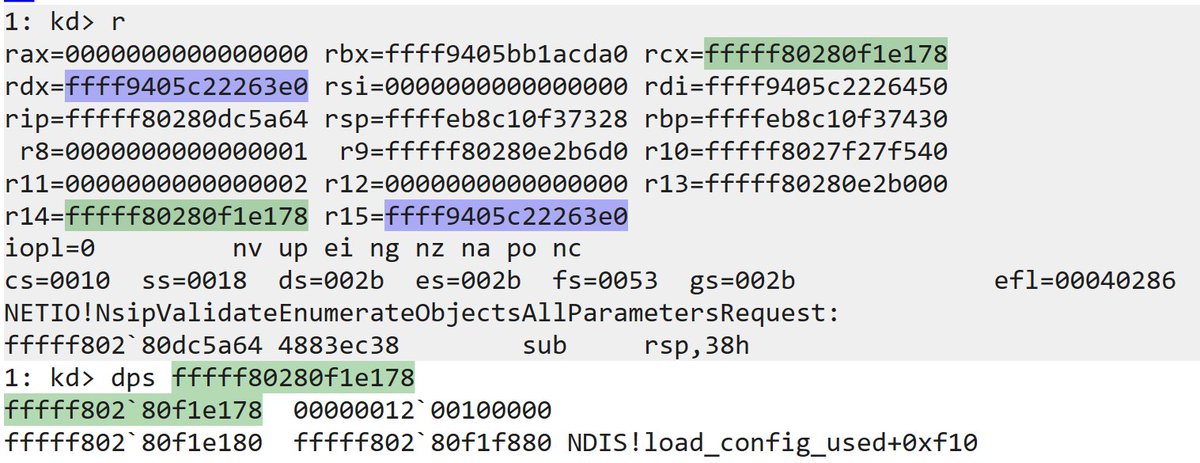
@yarden_shafir It also works across multiple windows, like the source window and the memory window.
Selecting the text and then ctrl-click works to add/remove highlighting, but I tend to hold ctrl and then double click on the number.
English

Did you know you can mark things in WinDbg in different colors to keep track of repeated values? I find it super useful when debugging things involving large data structures with no available symbols
English
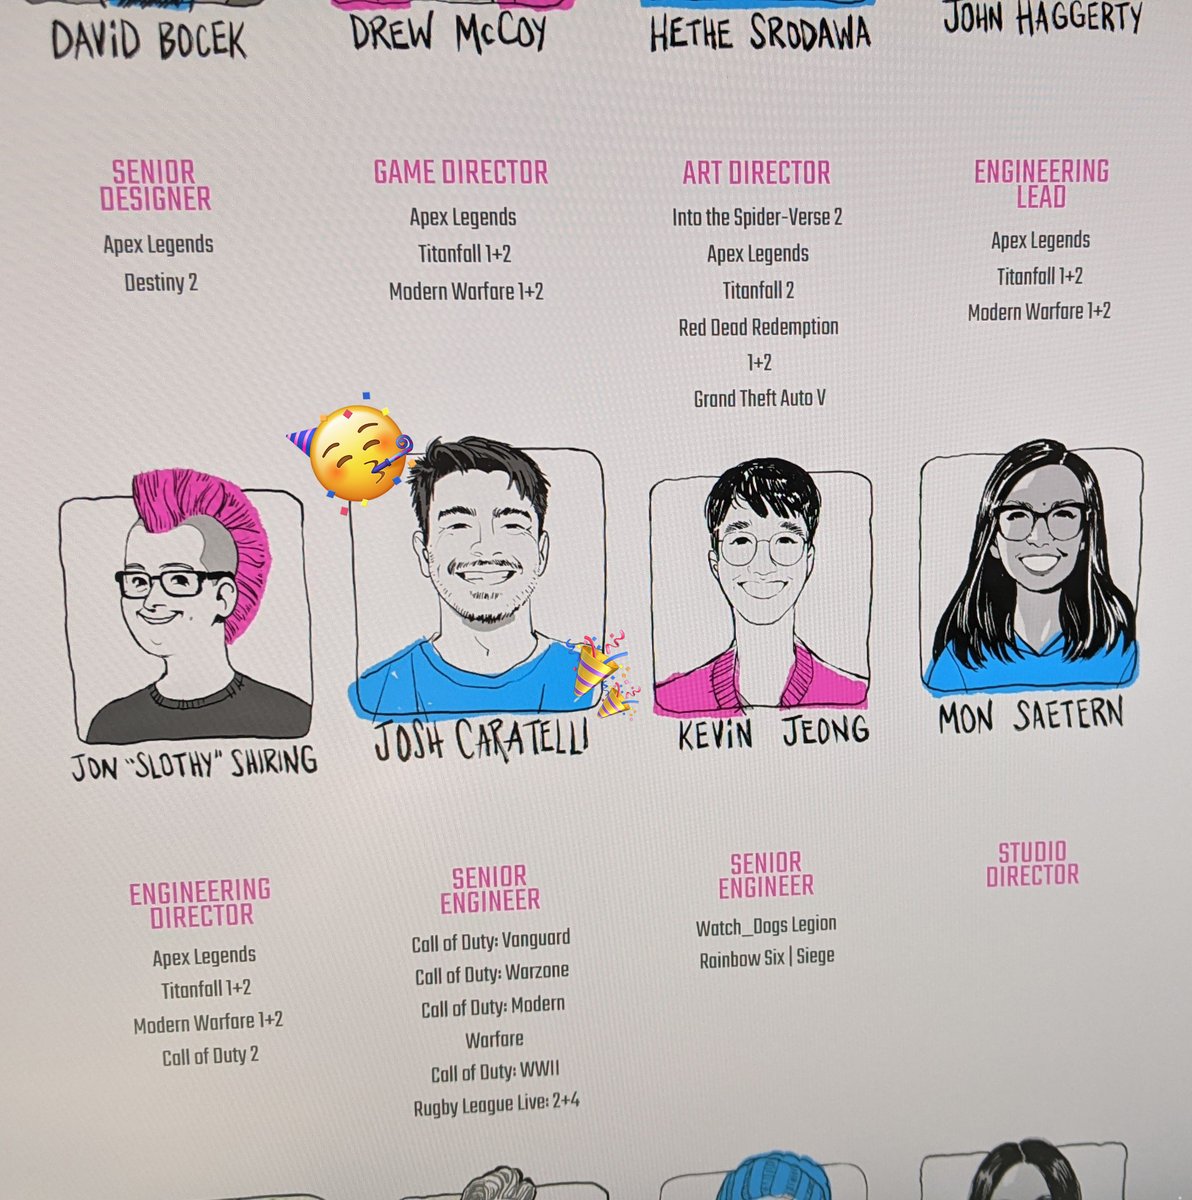
@josh_caratelli @charlietheGfish @gravitywell Though I would go so far as to say that you look about 10 years older in the portrait than your youthful real-life self. 😉
Congrats, Josh. I can't wait to hear what comes out from Gravity Well with you in their ranks!
English

@charlietheGfish @gravitywell Haha I thought so too! I've already slotted into unofficial cheerleader / hype guy / omg please stop talking Josh.
English
Excited to say I've joined some friends at @GravityWell (ex Respawn / Infinity Ward) as a Senior Engineer!
Loving my time already with this super rad and experienced team.
(Also check out these cool portraits @emilywarrenrice does for the website!)
English
@timmisiak Okay, it looks like x86 is the issue as the Disassembly view for a x64 application appears fine.
English
@timmisiak I'm trying to use this in windbgx client version 1.2206.19001.0, and although I can do something like `uf main` and see the variables in the output view listing I can only see raw addresses in the disassembly view. What am I doing wrong?
English
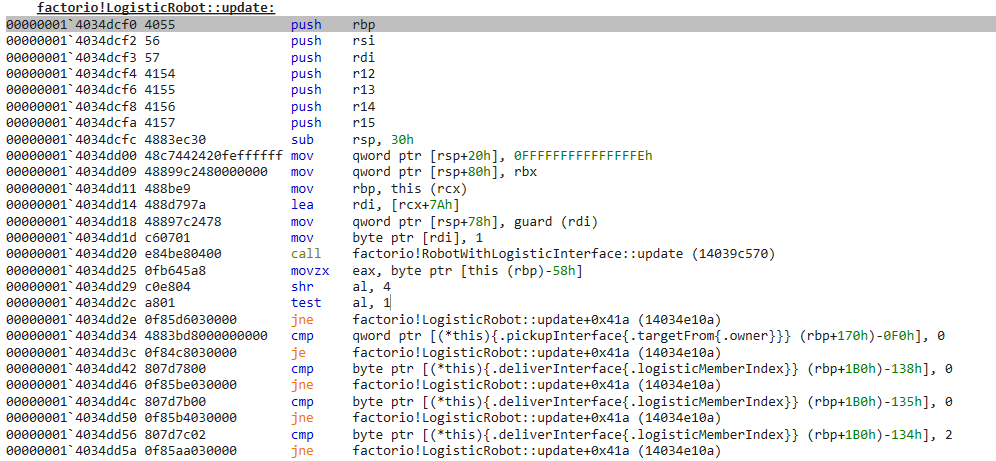
I finally got around to integrating the WinDbg disassembly window with the awesome disassembler that @wmessmer wrote. If you have symbols, it will resolve registers and memory locations to names. It also does some color coding on conditional/jumps/rets.
English

@timmisiak This is exactly the stuff I used to do with gdb and python and found it so valuable for debugging complex issues. I miss it so much, I really need to learn WinDbg (and JavaScript). Thanks for the cookbook repo!
English
I added a new script in the "WinDbg Cookbook" repo. A script that can watch for stack corruptions on a function by using a breakpoint that executes a JavaScript extension which creates other breakpoints. I'll be referencing it in my next blog post.
github.com/TimMisiak/WinD…
English
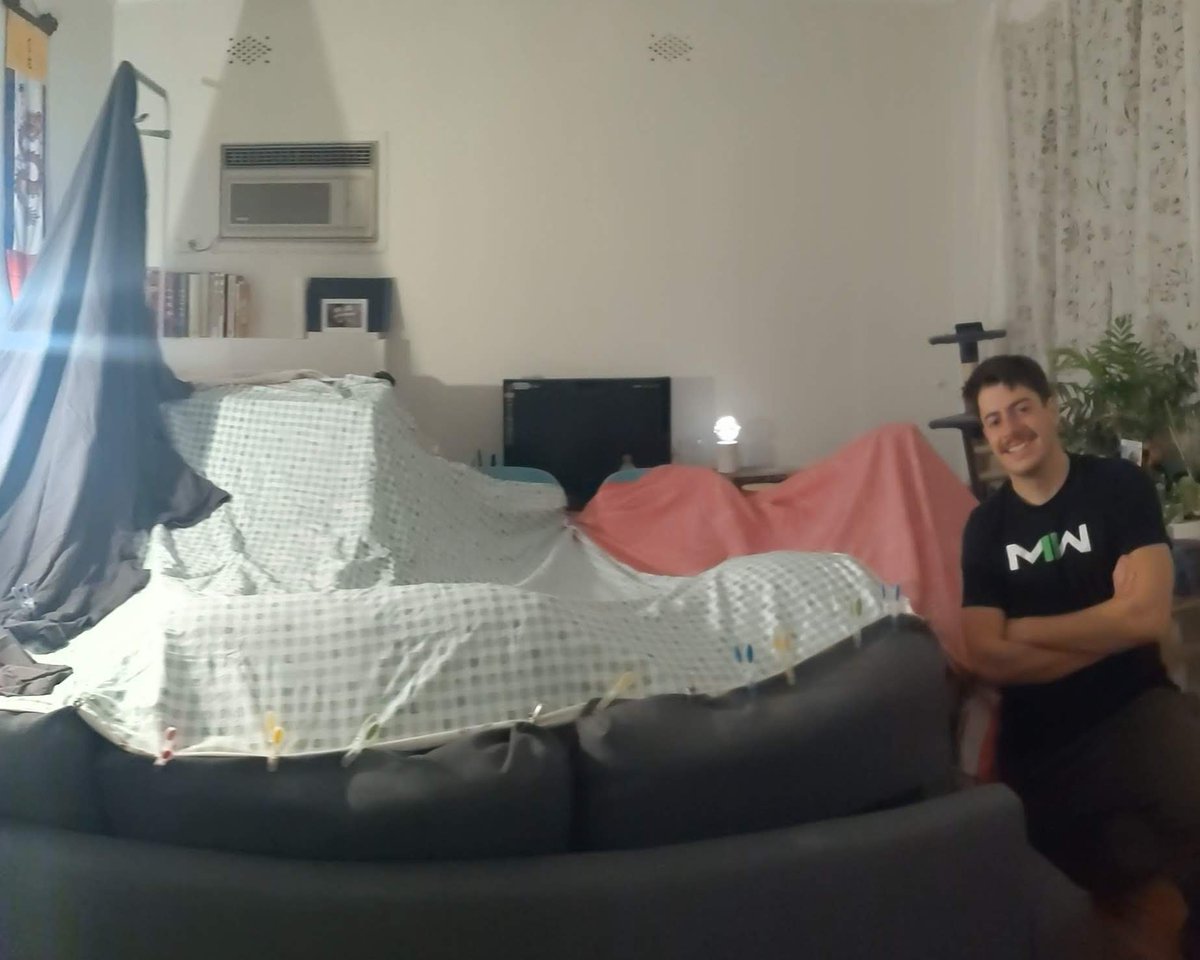
We got engaged in a Blanket Fort and honestly wouldn't have had it any other way.



English

@timmisiak What about something like what gdb has:
save breakpoints <filename>
and to restore:
source <filename>
Where "source" interprets any file containing gdb commands.
A WinDbg equivalent to save/edit/restore debugging session data in this way should cater to many workflows.
English
I think the votes are pretty clear. But based on the replies I got, I think it needs some configurability so you can control what gets saved. Not everyone wants their breakpoints saved (and a few other things)
Tim Misiak@timmisiak
If you launch a process that you've debugged before (or open the same dump/trace file again), do you want WinDbg to remember things like command history, symbol path, and breakpoints from your last session?
English
@trierman Thanks for the link! I'm keen to play with this as well - so funny to reconsider photon mapping so long after its hey day.
English
@trierman Wow, that's looking great. Is 500M photons/sec the read or write speed (and on what hardware)? Also, is the GPU hashmap implementation custom or based off something publicly accessible?
English
Is anyone else's copy of Real-Time Rendering (4th edition) losing pages? It's a thick book, but it feels like it hasn't taken much for a few pages to start falling out on my year-old copy.
@crcpress
English
@ARichardMSFT @timmisiak Speaking of which, I still go to reference some of the channel9 defrag tools episodes but can't find them at the new docs.microsoft.com location. From the Inside Show page it looks like it should be docs.microsoft.com/en-us/Shows/De… but (at least external to MS?) it doesn't resolve.
English
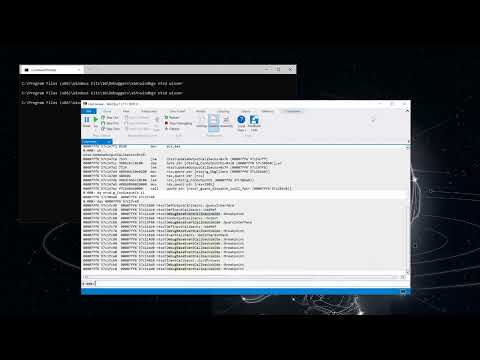
Just posted a video on the basics of how WinDbg, NTSD, and DbgEng work. I thought it would be interesting to do an explanation through a bit of "reverse engineering". Check it out here: youtube.com/watch?v=QStC08…
YouTube
English