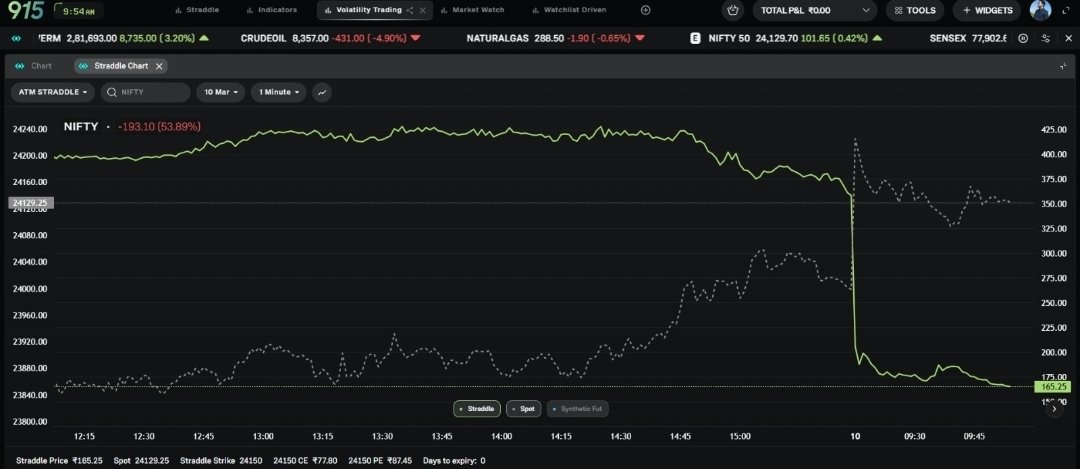
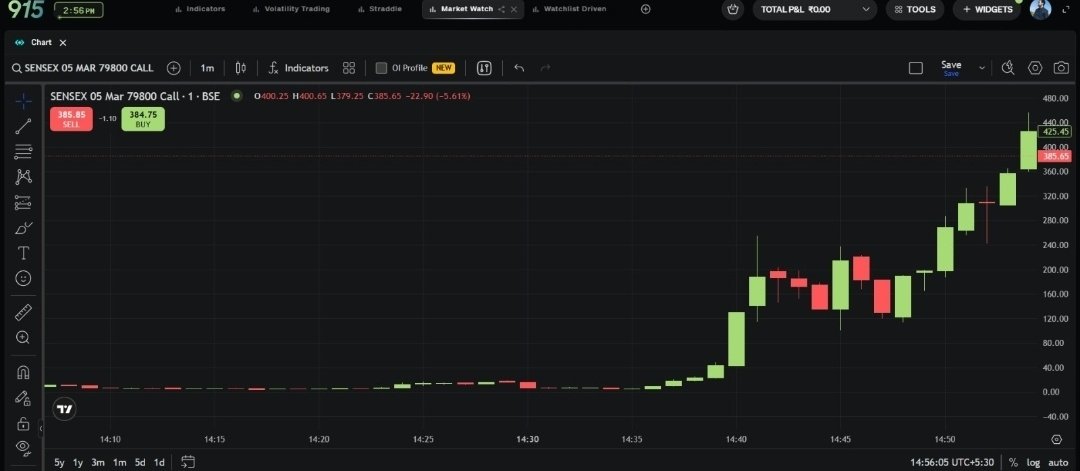
Trading view charges a load of money to brokers for a charting library which just plots candle charts. Some devs sat last night and claude coded native charts with all functionalities. We gonna launch it soon😂
Crude oil chart looks like the market feared supply disruption & then feared it a little less.
This is usually how high volatility events unfold in markets, as they tend to overreact to uncertainty.
It first prices catastrophe & then slowly prices probability.