Riskdials.com

839 posts

Riskdials.com banner
Riskdials.com

Riskdials.com

@riskdials

Where serious investors come to maximize their long term returns. This account mainly posts daily updates.

Katılım Eylül 2018
3 Takip Edilen1.5K Takipçiler
Sabitlenmiş Tweet
Riskdials.com
Riskdials.com@riskdials·
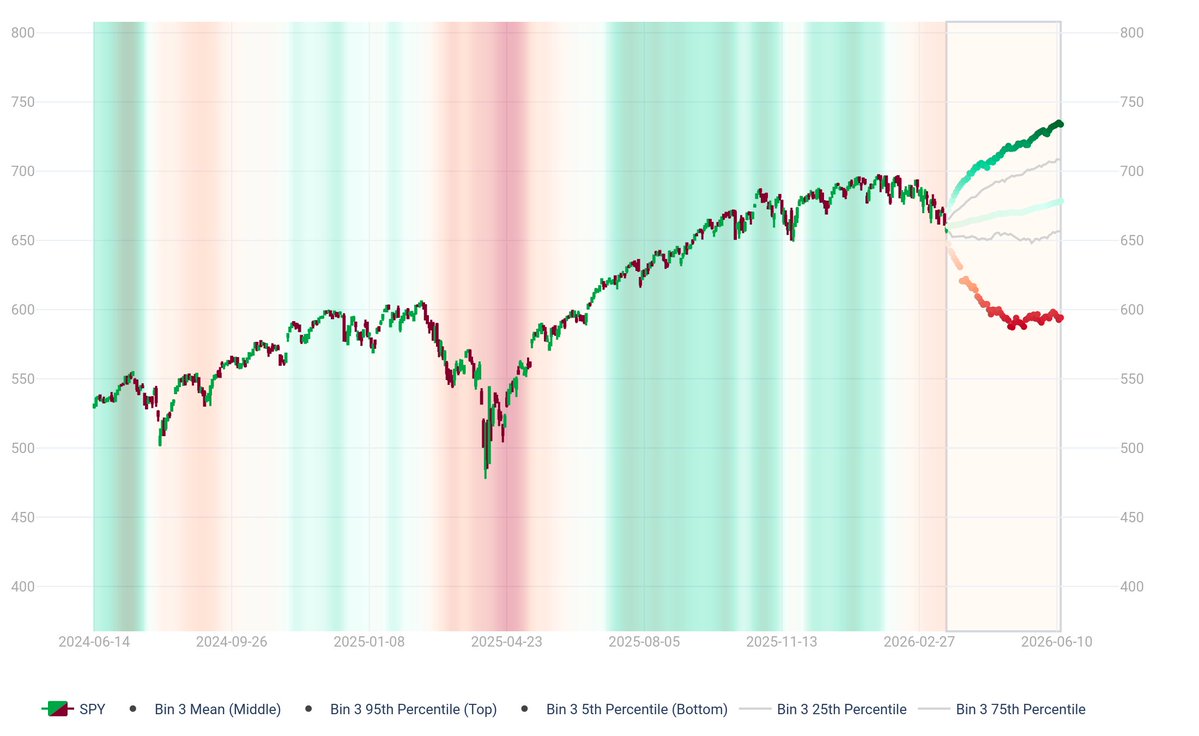
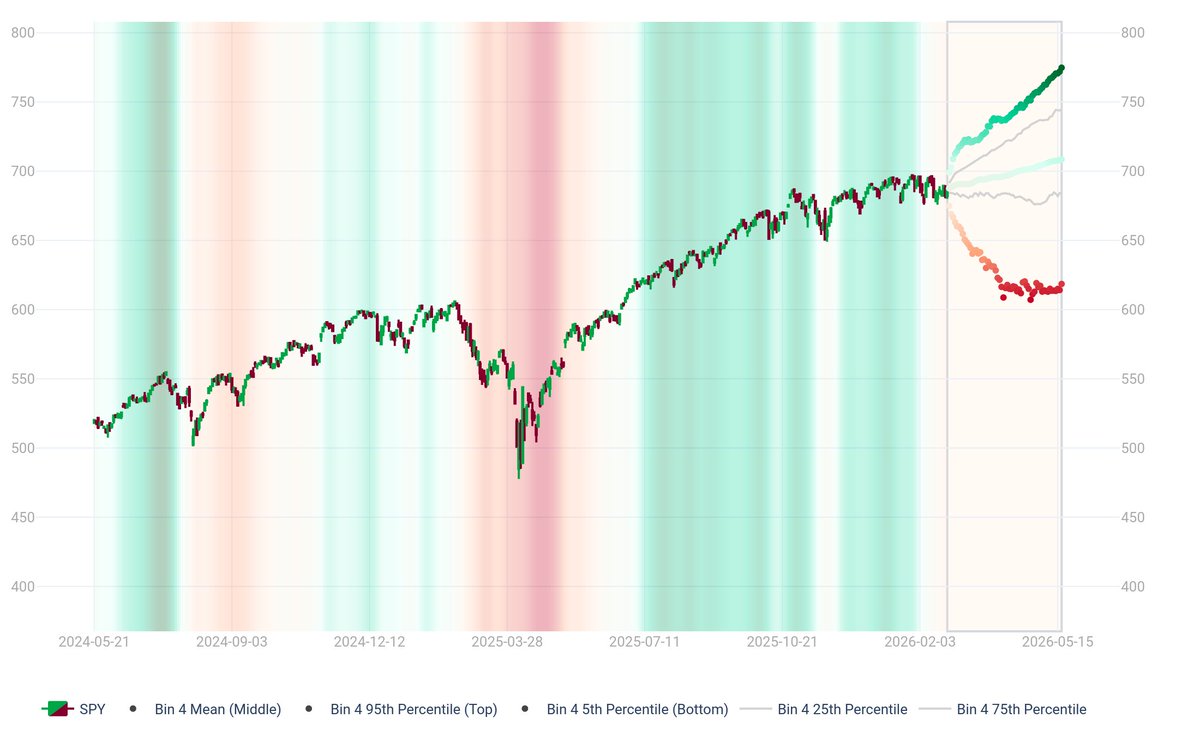
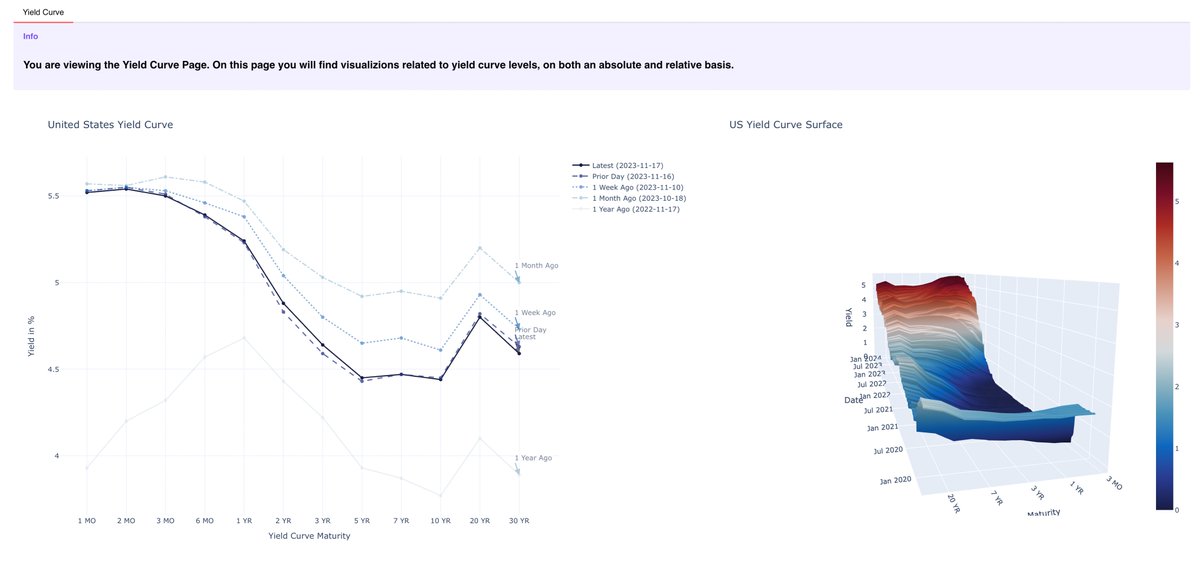
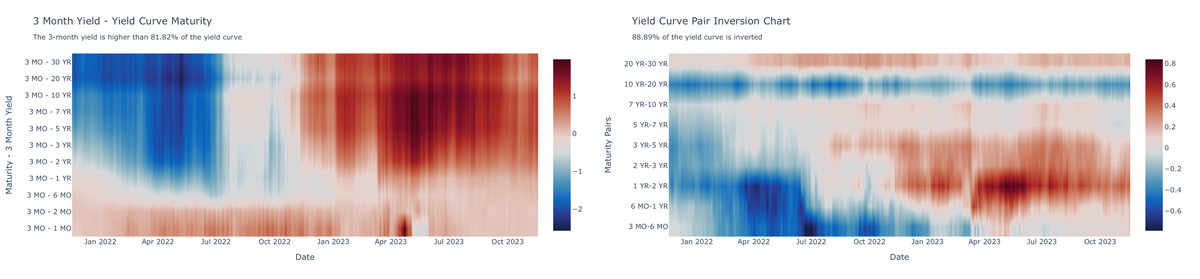
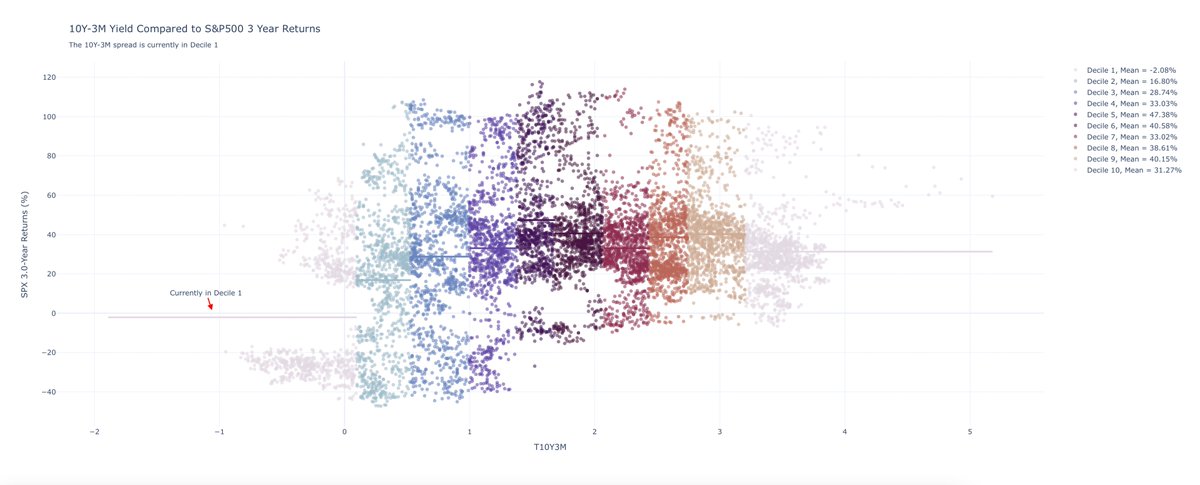
Monitor the US Yield curve and its implications for the S&P500 $SPY. Our Dashboard is updated daily. riskdials.com/yield-curve
Riskdials.com tweet mediaRiskdials.com tweet mediaRiskdials.com tweet media
English
0
2
12
3.5K
Riskdials.com
Riskdials.com@riskdials·
The riskdials.com reports have been generated for today and the app has been updated. The chart below is a chart from our research report and shows the range of prices that can be expected for $SPY over the following 60 trading days given the current Riskdial score.
Riskdials.com tweet media
English
0
1
2
218
Riskdials.com
Riskdials.com@riskdials·
The riskdials.com reports have been generated for today and the app has been updated. The chart below is a chart from the spread ratios report. The volatility attribution chart pin-points which groups of spread ratios are experiencing anamalous volatility.
Riskdials.com tweet media
English
0
0
0
78
Riskdials.com
Riskdials.com@riskdials·
The riskdials.com reports have been generated for today and the app has been updated. The chart below is a chart from the spread ratios report.. The scatter plot highlights which ratios are trending positively and negatively and their volatility and return ranks.
Riskdials.com tweet media
English
0
0
0
96
Riskdials.com
Riskdials.com@riskdials·
The riskdials.com reports have been generated for today and the app has been updated. The charts below are from the spread ratios report and track equal weight to cap weighted indices and sectors.
Riskdials.com tweet media
English
0
0
0
93
Riskdials.com
Riskdials.com@riskdials·
Sunday video is uploaded. Subscribers please log in and navigate to today's post: riskdials.com
Riskdials.com tweet media
English
0
0
0
99
Riskdials.com
Riskdials.com@riskdials·
The riskdials.com reports have been generated for today and the app has been updated. The chart below is a chart from our research report and depicts $SPY return probability distrbutions for multiple time periods given the current Riskdial score.
Riskdials.com tweet media
English
0
0
0
155
Riskdials.com
Riskdials.com@riskdials·
The riskdials.com reports have been generated for today and the app has been updated. The chart below is a chart from the spread ratios report. The volatility attribution chart pin-points which groups of spread ratios are experiencing anamalous volatility.
Riskdials.com tweet media
English
0
0
0
83
Riskdials.com
Riskdials.com@riskdials·
The riskdials.com reports have been generated for today and the app has been updated. The chart below is a chart from our research report and shows the $SPY 75th percentile realized volatility that can be expected given the current model score.
Riskdials.com tweet media
English
0
0
0
148
Riskdials.com
Riskdials.com@riskdials·
The riskdials.com reports have been generated for today and the app has been updated. The chart below is a chart from our research report and depicts $SPY 60-day returns by market score range.
Riskdials.com tweet media
English
0
0
0
102
Riskdials.com
Riskdials.com@riskdials·
The riskdials.com reports have been generated for today and the app has been updated. The charts below are from the spread ratios report and track equal weight to cap weighted indices and sectors.
Riskdials.com tweet media
English
0
0
0
109
Riskdials.com
Riskdials.com@riskdials·
The riskdials.com reports have been generated for today and the app has been updated. The spread ratio charts below focus on international Risk-On to Risk-Off relationships.
Riskdials.com tweet media
English
0
0
1
105
Riskdials.com
Riskdials.com@riskdials·
The riskdials.com reports have been generated for today and the app has been updated. The charts below are from the spread ratios report. These compare Risk-Off assets to other Risk-Off assets.
Riskdials.com tweet media
English
0
0
0
93
Riskdials.com
Riskdials.com@riskdials·
The riskdials.com reports have been generated for today and the app has been updated. The chart below is a chart from spread ratios report. These spread ratio charts compare various Risk-On to Risk-Off assets.
Riskdials.com tweet media
English
0
0
0
100
Riskdials.com
Riskdials.com@riskdials·
The riskdials.com reports have been generated for today and the app has been updated. The chart below is a chart from our research report and depicts $SPY 60-day return distrbutions for each range of Riskdial score.
Riskdials.com tweet media
English
0
0
0
130
Riskdials.com
Riskdials.com@riskdials·
The riskdials.com reports have been generated for today and the app has been updated. The chart below is a chart from our research report and shows the $SPY 75th percentile realized volatility that can be expected given the current model score.
Riskdials.com tweet media
English
0
0
0
125
Riskdials.com
Riskdials.com@riskdials·
Sunday video is uploaded. Subscribers please log in and navigate to today's post: riskdials.com
Riskdials.com tweet media
English
0
0
0
80
Riskdials.com
Riskdials.com@riskdials·
The riskdials.com reports have been generated for today and the app has been updated. The chart below is a chart from our research report and shows the $SPY 95th percentile realized volatility that can be expected given the current model score.
Riskdials.com tweet media
English
0
0
0
107
Riskdials.com
Riskdials.com@riskdials·
The riskdials.com reports have been generated for today and the app has been updated. The charts below are from the spread ratios report and track equal weight to cap weighted indices and sectors.
Riskdials.com tweet media
English
0
0
0
99
Riskdials.com
Riskdials.com@riskdials·
The riskdials.com reports have been generated for today and the app has been updated. The chart below is a chart from our research report and depicts $SPY 60-day return distrbutions for each range of Riskdial score.
Riskdials.com tweet media
English
0
0
0
110
Riskdials.com
Riskdials.com@riskdials·
The riskdials.com reports have been generated for today and the app has been updated. The chart below is a chart from our research report and shows the range of prices that can be expected for $SPY over the following 60 trading days given the current Riskdial score.
Riskdials.com tweet media
English
0
0
1
95