Economic Development from Nighttime Lights. You can help us study how changes in laws affects economic development using satellite imagery of nighttime lights, while learning to work with raster images, geographic data and machine learning. sandiegodata.org/2021/07/econom…
Civic Tech Opportunity: The Atlas, an online community that connects government and tech, is recruiting a data engineer. sandiegodata.org/2021/04/civic-…
Exploring Inequality with Survey Data. We will be exploring how to study inequality with the Survey of Consumer Finances tonight at 7:00. sandiegodata.org/2021/01/explor…
A map of high values for number of unique devices is an indication of population density. ( Or density + bad Internet ... ) Downtown and the Airport are prominent.
A fantastic new dataset for mapping populations: The Ookla speed test dataset. tinyurl.com/yyuf2q3b. It has a square geo grid with average d/u speeds and number of devices, for fixed and mobile.
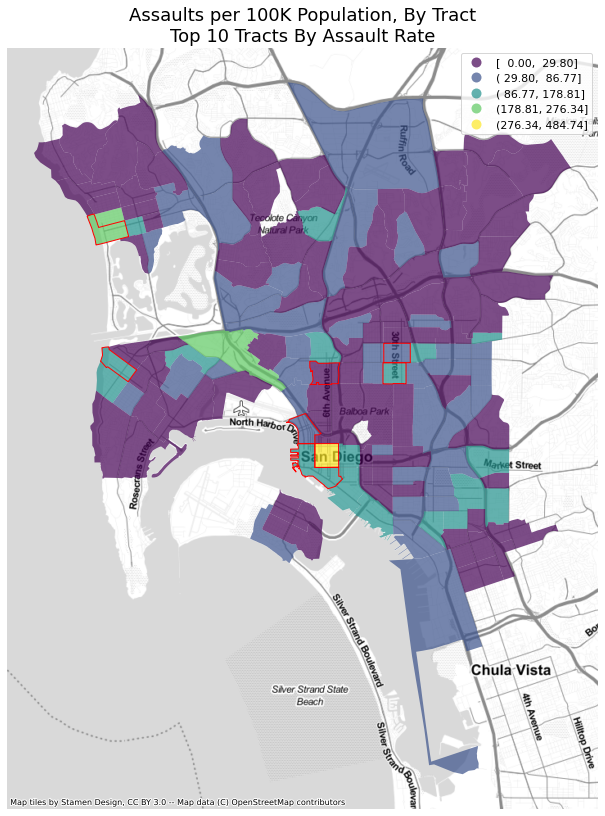
Learn to Analyze Crime. Tonight at 7 we will be learning about how to explore crime datasets using Tableau, QGIS and Jupyter/Colab. sandiegodata.org/crime
Getting Started with Crime Analysis. We will examine important crime datasets and explore them with Python, Tableau and QGIS. sandiegodata.org/2020/11/gettin…
@omarpassons There may be racial issues that are the ultimate cause of the poverty problem -- there is always a chain of more or less proximal causes -- but from this report the most proximal cause appears to be poverty
@omarpassons The report also contains some good news: All of the gaps adjust to 7% or less of a standard deviation, and the reading gap *reverses* with controls. That means we have a poverty problem, not a race+poverty problem, which is much easier to address.