StockEducator.Pro

10.4K posts

StockEducator.Pro banner
StockEducator.Pro

StockEducator.Pro

@smith_dad

Retired mkt timer of OPM. Price, velocity, fibs, and RS. 'Perversion of the mean'. "Smith Bands" creator. Dancer, MTB racer, skier, SCUBA-doo. BS-CS-UCI

Orange County, CA Katılım Ağustos 2012
441 Takip Edilen1.7K Takipçiler
Sabitlenmiş Tweet
StockEducator.Pro
StockEducator.Pro@smith_dad·
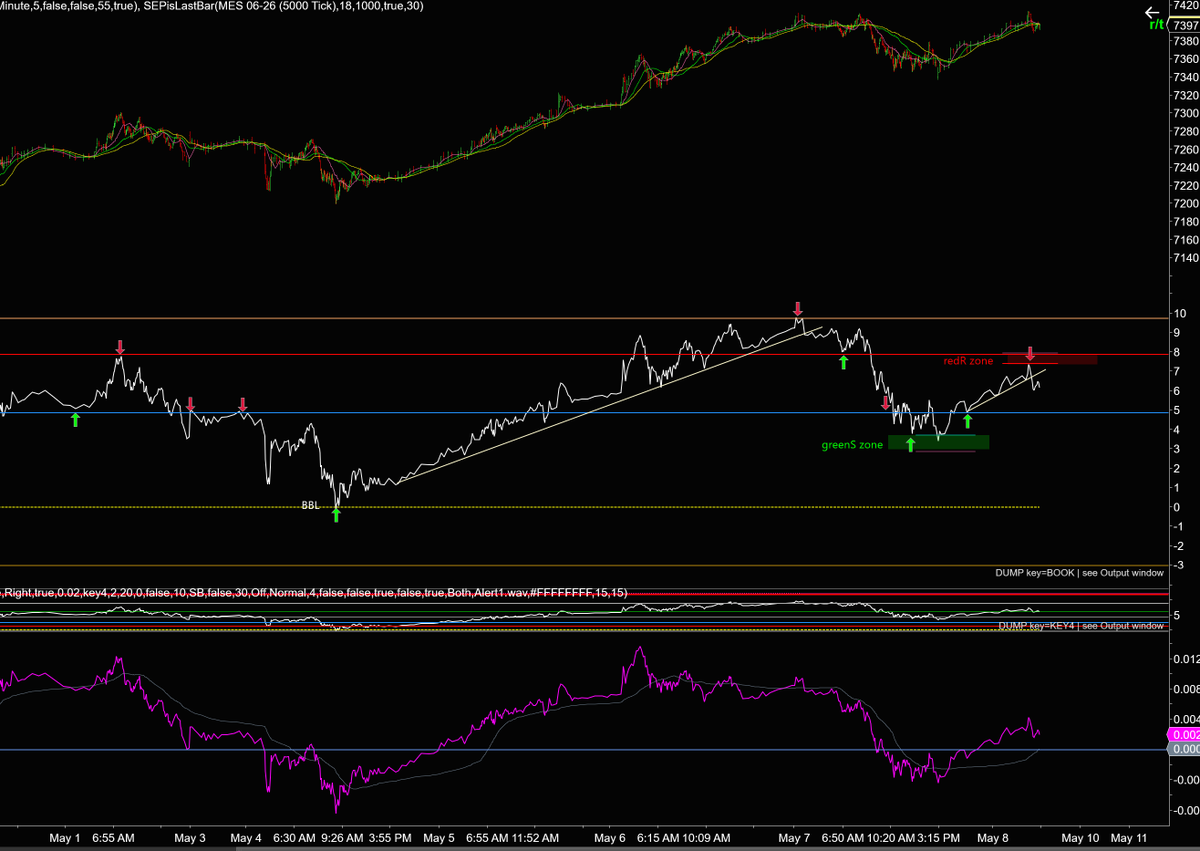
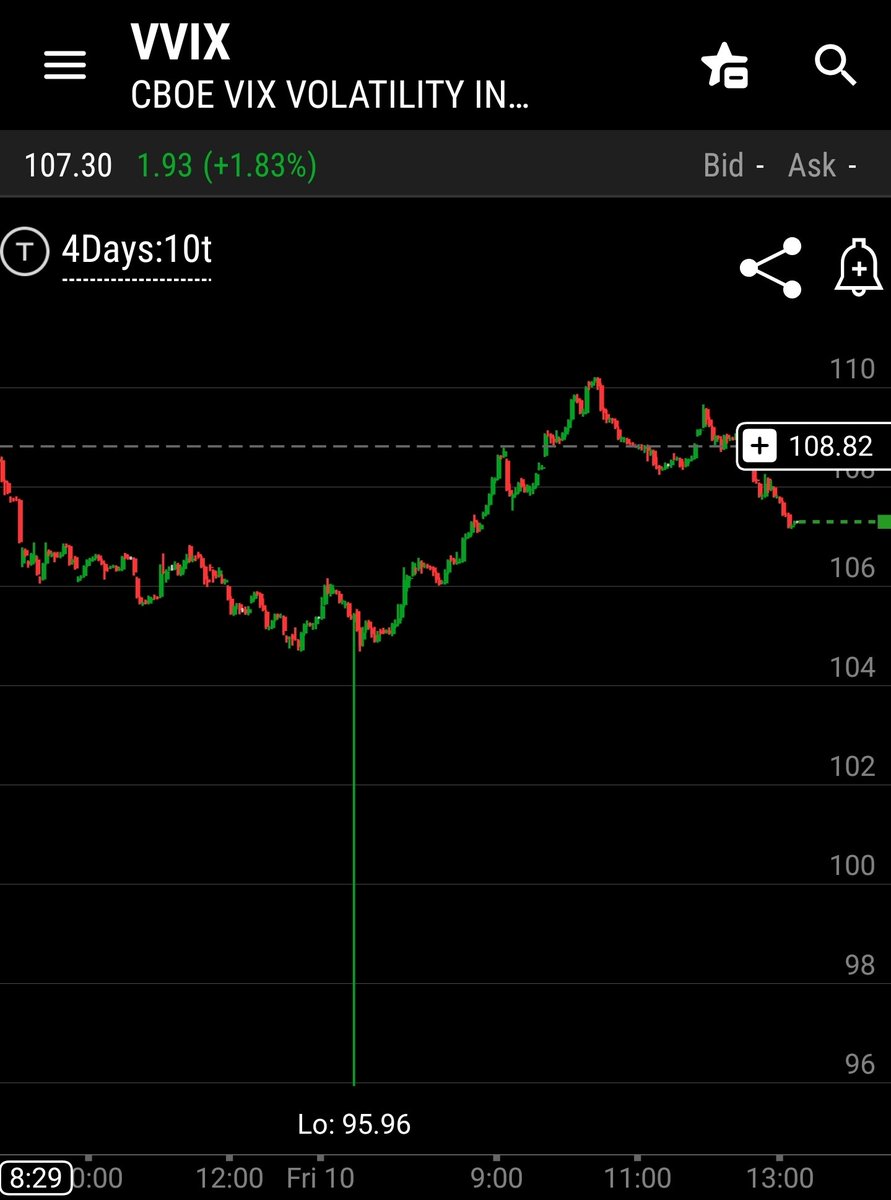
Bingo. Velocity reached the target I've been warning about. Just imagine if I still had clients, and they were in cash throughout this crash.....That was my role for them first, and second was to position in leading asset classes/sectors. 
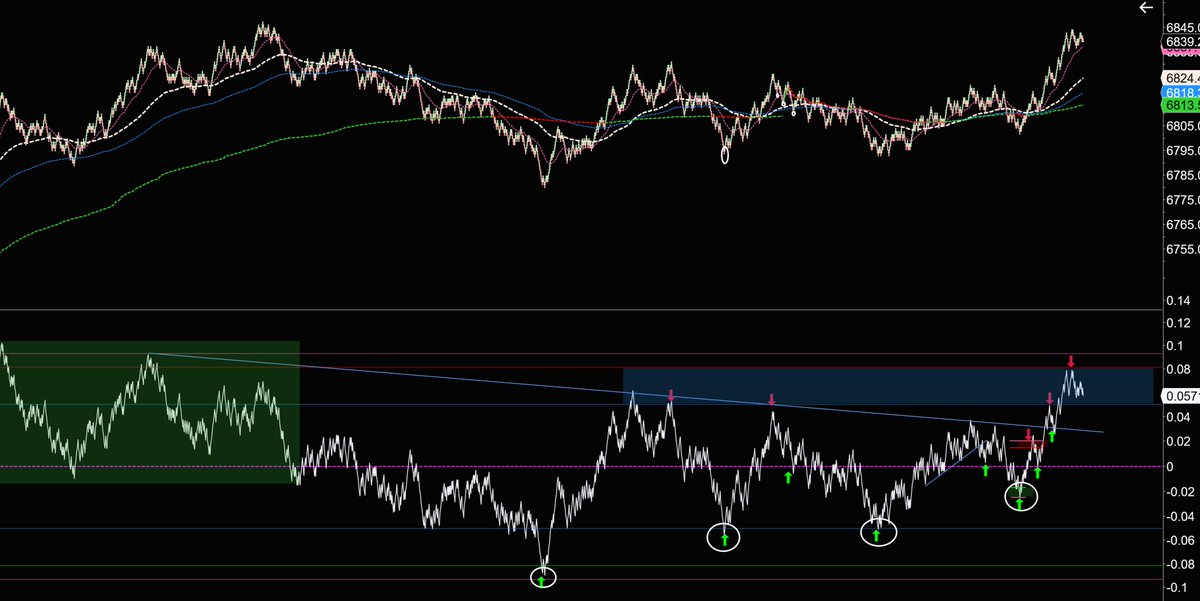
Now, this is just a 1st step toward
StockEducator.Pro tweet media
English
3
1
7
2.5K
StockEducator.Pro
StockEducator.Pro@smith_dad·
Pointed out a target reached, ensuing relative weakness in NQ vs. ES, a failed breakout (and expectation), and interim support for the current bounce. The 5000-tick chart bounced EXACTLY on BBL, so the confluence with this 10-Renko was helpful for the current long. $ES $NQ $SPX $NDX $SPY $QQQ $UPRO $TQQQ
StockEducator.Pro tweet mediaStockEducator.Pro tweet mediaStockEducator.Pro tweet mediaStockEducator.Pro tweet media
English
0
0
0
61
StockEducator.Pro
StockEducator.Pro@smith_dad·
My $ES model broke through recent resistance, and has pulled back to test it. The $NQ model is threatening to drop through support, but is bouncing here. Any lower, and I'll expect more weakness. $SPX $NDX $QQQ $SPY $TQQQ
StockEducator.Pro tweet mediaStockEducator.Pro tweet media
English
0
0
0
149
StockEducator.Pro
StockEducator.Pro@smith_dad·
The gap down reached where C=61.8%A. (The prior chart shows an A, but the move after B was a full 5 reversals for a C, and that ABC was a larger A fractal. The pop to the 50% was B, and the C I postulated ended up being 61.8% of the prior ABC.) The larger timeframe shows the greenS that manifested at the low, followed by the redS -- both of which were actionable. Yesterday's timeframe had a purple speed bounce at BBL moments ago at ES 7391.50, hence the nice pop since. This is still a back-test of the failed up move, and when done, should come back down. The proper trade is the BBL long, not "should come back down". That'll reveal itself if/when.... $ES $NQ $SPX $NDX $SPY $QQQ $UPRO $TQQQ
StockEducator.Pro tweet media
English
0
0
0
100
StockEducator.Pro
StockEducator.Pro@smith_dad·
"Start" is misleading. It would have begun at 7378.
English
1
0
0
102
StockEducator.Pro
StockEducator.Pro@smith_dad·
I've been bullish since the recent bottom where all manner of fib confluences met. After a speed failure yesterday, ES is mildly correcting and has a lower speed target. I'm not expecting this to be dramatic however, but will monitor subsequent bounces for failures. Obviously, velocity has been rolling over even as price highs went still higher. While typing, speed dropped to the green SmithBand, and I'll be looking for signs of a reversal here. $ES $NQ $NDX $SPX $QQQ $SPY $TQQQ $SQQQ
StockEducator.Pro tweet media
English
1
0
0
201
👑Beno10
👑Beno10@Beno10_MFC·
Almost all people with high IQ underestimated this mathematical problem and ended up failing. Be smart Can you solve?
👑Beno10 tweet media
English
5.3K
109
655
409.5K
Andrew
Andrew@AndrewTradesNQ·
@tradertheory Mfs think that hedge funds are worried about your stop losses, meanwhile the total retail trading volume makes up like 5% of the whole
English
3
0
15
2.9K
Trader Theory
Trader Theory@tradertheory·
A market that moves $7 trillion a day and you still can't take $100 out of it.
English
177
629
9.1K
296K
Arden Gray 🇺🇸
Arden Gray 🇺🇸@Arden_2210·
Only 1% notice the hidden pattern. Are you the 1%? 3 = ? Your answer says a lot about your iQ
Arden Gray 🇺🇸 tweet media
English
7.2K
155
893
265.6K
StockEducator.Pro
StockEducator.Pro@smith_dad·
Ha! Another coincidence.....speed returned to the white-hot level again. 😎 I haven't been actively posting here, but all day I share what I'm seeing (and often late night too). Fibs on price were fantastic yest and today too! Speed and its SmithBands gave entries at safe levels all day. These are but two charts I look at. I'm now working with Codex on a method to normalize and combine multiple timeframes onto a single chart --- it's too hard for me to track different instruments/timeframes with honesty. (One solution is to zoom out, but I like the entertainment!) $ES $NQ $SPX $NDX $SPY $QQQ $UPRO $TQQQ
StockEducator.Pro tweet mediaStockEducator.Pro tweet media
English
1
0
1
182
StockEducator.Pro
StockEducator.Pro@smith_dad·
Five waves up. Repealed the last upon completion. Had divergence, blah blah blah. Speed peaked at the white SmithBand, reverted to....the complement white SmithBand. Nothing to see here. Market is just a random walk. Everything is efficient. An FVG caused this, or maybe news did. Nobody knew nothin'. "I see nothing, Colonel Hogan!" $ES $NQ $SPX $NDX $SPY $QQQ $UPRO $TQQQ
StockEducator.Pro tweet media
English
1
0
1
269
StockEducator.Pro
StockEducator.Pro@smith_dad·
That spike down did not occur at the open nor at the end of A period. It looks like a data error. This is a 10 tick chart spanning part of yesterday and all of today. It's a single bar, and if accurate, would represent roughly a 8.6% crash followed by a 9.4% rally all in the span of seconds, with no visible bounces in between.
StockEducator.Pro tweet media
English
1
0
1
310
Astro Zan
Astro Zan@alshfaw·
$SPY Turbulence on the Way | $VVIX The inverse head on VVIX, see chart below, is what your mom warned you against when you were young. This is a textbook example of a "volatility vacuum". Everyone abandoned $VIX. When VVIX dives toward that $94$ zone and snaps back to $109+$ instantly, it suggests the market over-extended its "ceasefire peace" and is now violently re-pricing risk. In my dictionary, this is enough for $667 or lower next week, regardless of where we close today. Today, they stirred up the pot in the opposite direction, that's that green candle shown below. That's a long stick to stir with 😜 Share & Subscribe, : $SPY $QQQ $IWM $MDY $RUT $DIA $SDOW $SOXX $SOXS $SMH $NVDA $TSLA $YINN $VIX $VXX $TLT $BTC $GLD $SLV $SVXY
Astro Zan tweet media
English
11
6
137
26.6K
StockEducator.Pro
StockEducator.Pro@smith_dad·
I'm the puppet master, so I ultimately must take the blame for my extraordinary delays in AI-assisted software development. I've used Chad (chatGPT) for website development (something I don't know) and application development (indicators/strategies) - something I know a little about after 48 years since I started with Fortran IV and RPG II. (I even wrote a video game in the latter in 80x24 res.🤣) I so want to give Chad the reins due to his insights and incredibly fast turnaround. He can juggle myriad factors and track them from start to finish while I'd still be doing OOA&D. But.... ....ask him to make a sandwich, and he'll figure out how to complicate as if it were a seven-course meal. This makes testing more complicated, too. And talk about arrogance! (I remember my youthful arrogance... I won a contract in the 1980's to design a recursive optimizing system. I had it prototyped with a functioning engine in three days. When I went to deploy it, I came to learn that the target machine didn't support recursion, and a total re-write to a flat/stack model was required. I lost my fanny on that one!) Chad frequently says, "This will fix that, and you can move on to the next phase." Uh, no. Didn't fix it - reverting.... He tells me that Claude Code is better at some things, and worse at others. I think I need to find out what it's better at.
StockEducator.Pro tweet media
English
1
0
0
174
StockEducator.Pro
StockEducator.Pro@smith_dad·
No annotations were made on the ES price chart. SmithBands on velocity did the trick. (I still considered price fibs, structure, EW, etc. Arrows are not trades --- just pointing out where S and R get pinged. I do have to sleep too!) $ES $NQ $SPX $NDX $SPY $QQQ $UPRO $TQQQ
StockEducator.Pro tweet media
English
0
0
0
186
Uranium Supremo
Uranium Supremo@UraniumGuru24·
@TraderLion Position sizing separates pros from gamblers. Add to winners and gains compound. Add to losers and mistakes compound. Simple but not easy. 📊
English
1
0
4
410
TraderLion
TraderLion@TraderLion·
Mark Minervini never goes all in on the first entry. Every position starts at a fourth, a fifth, a sixth of full size. He only adds when the trade proves him right -- never when it's going against him. The best trades let you add. The worst ones demand it.
English
4
49
412
39.1K
StockEducator.Pro
StockEducator.Pro@smith_dad·
T2 was reached today for ES. I eye-balled and suggested T2 at 6842 was on tap yesterday, in a Discord (not mine, and no financial interest). I was off by five points -- not bad for a monster day (night). The market has now retraced a little more than 61.8% of the prior 9% down move. If bears are truly in control, there's a lot that must be surrendered to prove it. As usual, I find it easier to trade where it seems the market is heading: fib targets on price, SmithBands on velocity, and where swings produce fib-sized echoes. I can't tell if this is a W3 or a C, but either way, it's enjoyable for the trend followers. At the recent bottom, there were plenty of confluent fib levels reached. Additionally, there was an important velocity relationship realized that is always worth respecting. (In fact, that setup paid four times today.) For now, let's see if this 61.8 sell zone hurts the bulls, or if they can push through. $ES $NQ $SPX $NDX $SPY $QQQ $UPRO $TQQQ
English
0
0
0
89
StockEducator.Pro
StockEducator.Pro@smith_dad·
T1 is not usually the end of the line, but it can pause or even temporarily reject. This is the composite, going back about four days. Just trying to show that despite the rollercoaster, the proportions are actually normal/reasonable. I posted this earlier in a Discord I hang out in (not mine and no financial interest). $ES $NQ $SPX $NDX $SPY $QQQ $UPRO $TQQQ
StockEducator.Pro tweet media
English
1
0
0
148