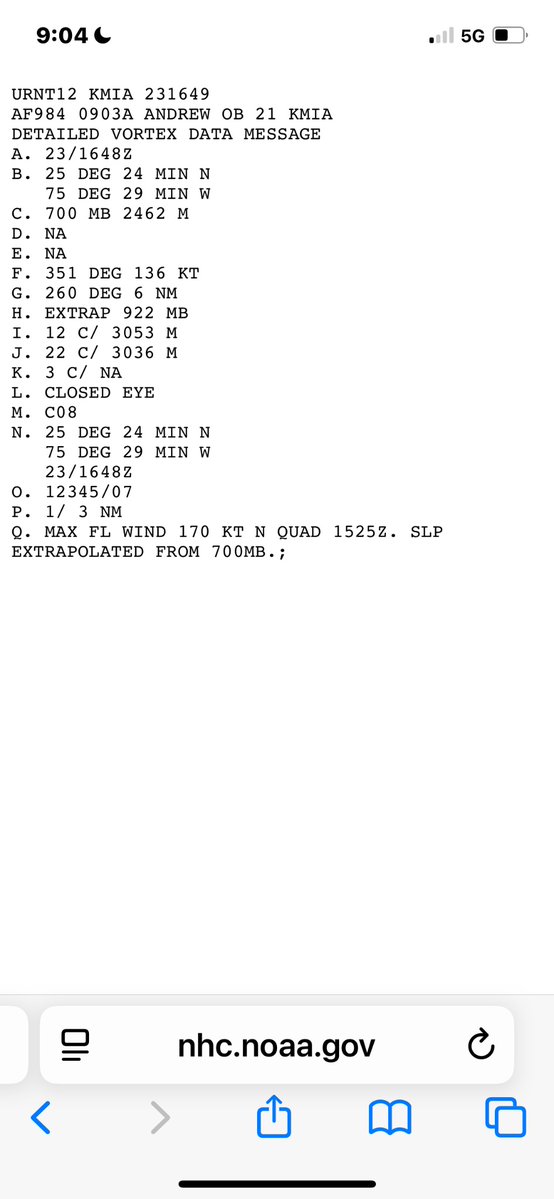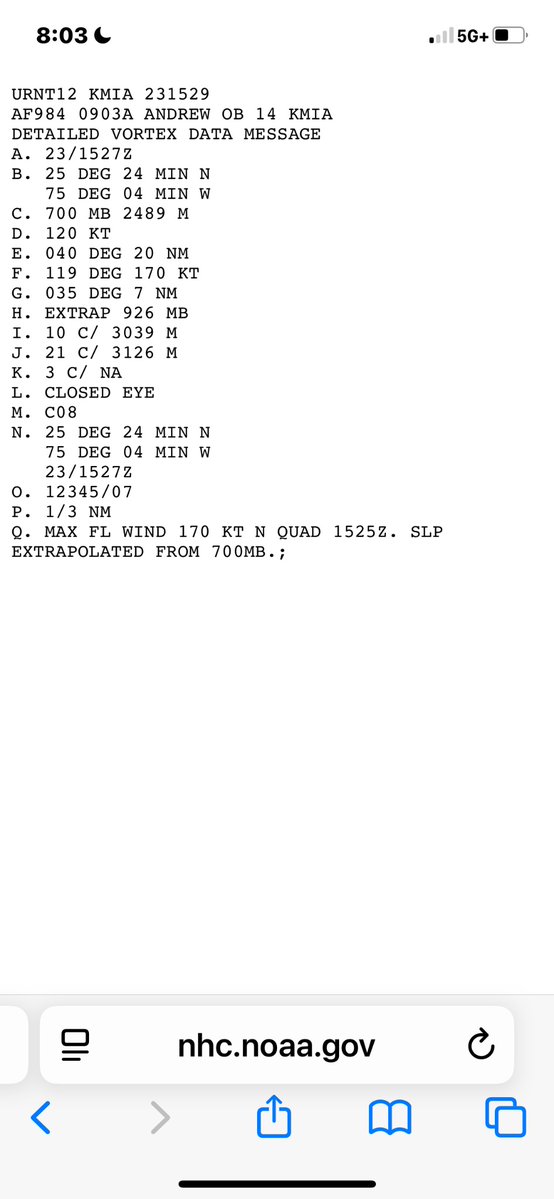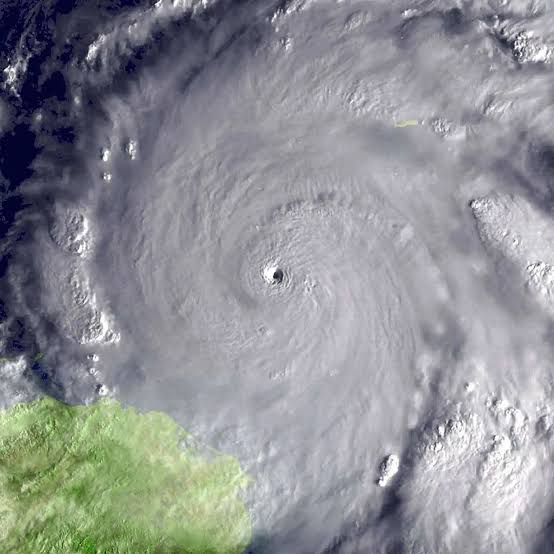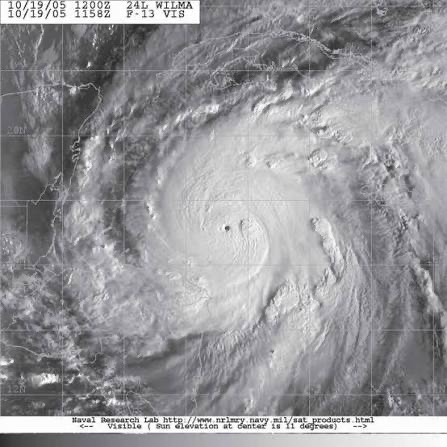


Follow-up on my #Hurricane Wilma reanalysis to align with the structure/frame work of my latest post on Andrew. The Key Reconnaissance Data: The 0800Z Hurricane Hunter’s eye fix showed a 168 kt peak FLW (SE eyewall) with a corresponding estimated MSLP of 882 mb obtained via dropsonde. The NHC applied the standard flight-level reduction factor (0.90) to get a 151 kt surface wind. Since the aircraft left during an ongoing rapid intensification (RI) phase — eye at record 2.3 n mi diameter (smallest ever in Atlantic) with a corresponding tiny RMW — they interpolated an additional 9 kt to the estimated maximum sustained winds and retained the 882 mb central pressure at 1200Z. My Reduction Factor Approach: As I’ve been discussing throughout these reanalysis of the strongest hurricanes on record in the NATL basin, a higher FLW-to-surface ratio is certainly warranted here as well. For such extreme compactness (high inertial stability, supergradient winds), reduced boundary-layer mixing limits turbulent downward momentum drag, allowing surface winds closer to flight-level (Powell et al. slant reduction studies + Kepert boundary-layer analyses support a 0.93–0.94 factor in small-RMW storms). Application of 0.935 to 168 kt FLW equates to a 157.1 kt surface wind at 0800Z. With continued (but slowing) RI to 1200Z (pressure trend + slightly further RMW contraction), I arrive at the following interpolated peak intensity: * MSW: 165 kt (190 mph) * MSLP: 880 mb Another way to calculate the MSW is to interpolate the likely increase in the FLW over the interceding 4 hour period of 0800Z-1200Z to get 174 kt x 0.935 = 162.7 kt. This edges above NHC's more conservative benchmark, as the tiny eye/RMW physics + KZC-like adjustments suggest 165 kt/880 mb is most accurate — placing #Wilma into the truly upper-elite (along with 1935 GLDH and #Melissa) amongst all known Atlantic TCs on record (dating back to 1851). Next Reanalysis Subject: Hurricane Milton (2024) Sources: 1. NHC Hurricane Wilma TCR: nhc.noaa.gov/data/tcr/AL252… 2. Powell et al. (2009) – on flight-level wind reductions and SFMR-based estimates: journals.ametsoc.org/downloadpdf/vi… 3. Kepert et al (2016) — on why the tropical cyclone boundary-layer isn’t ‘‘well mixed”: journals.ametsoc.org/downloadpdf/vi… #Reanalysis