Aksel Kibar, CMT

43.1K posts

Aksel Kibar, CMT banner
Aksel Kibar, CMT

Aksel Kibar, CMT

@TechCharts

Chartered Market Technician (CMT) and Classical chart trader. Ex-Fund manager. 📈 ➡️ https://t.co/VSwr0eryIS 📺 ➡️ https://t.co/XFZI3RE8aj
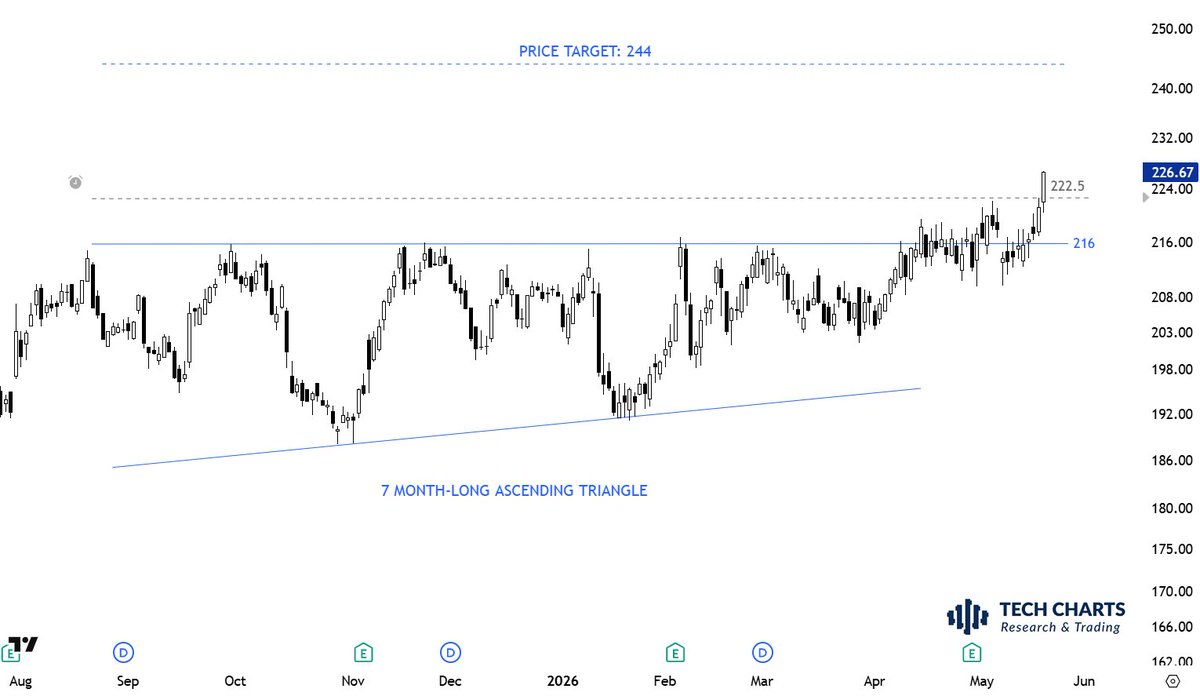
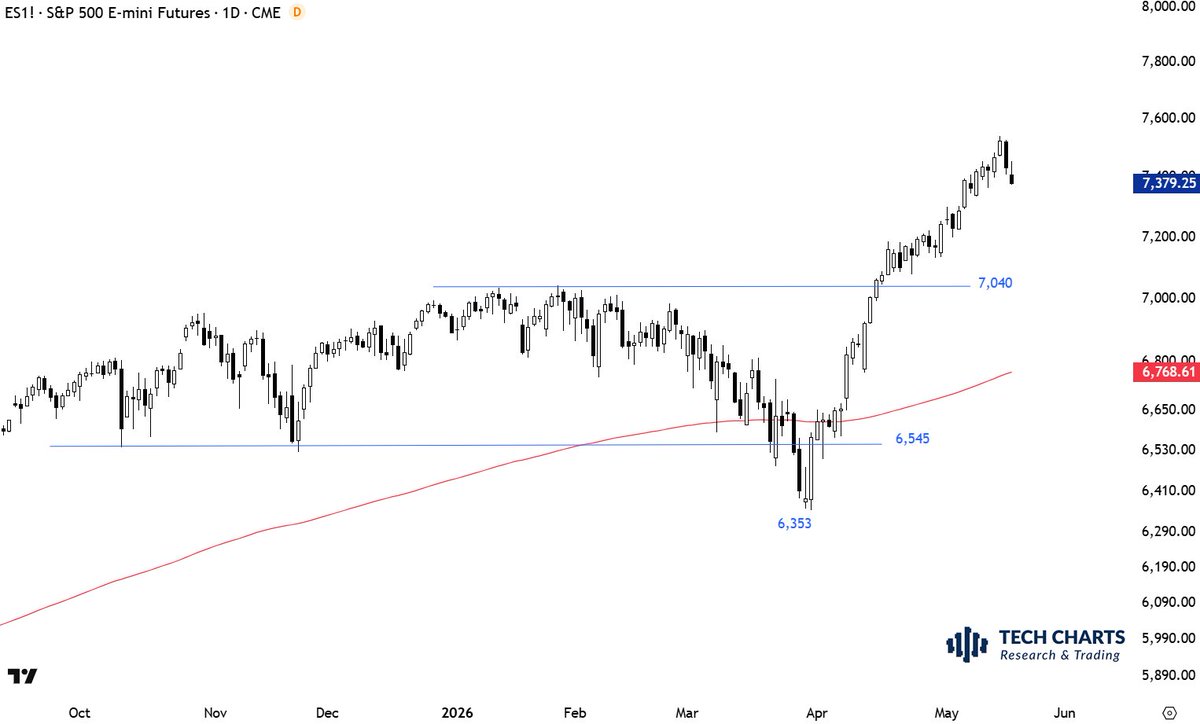
Bansko, BULGARIA Katılım Mayıs 2011
448 Takip Edilen176.6K Takipçiler
Sabitlenmiş Tweet
Aksel Kibar, CMT
Aksel Kibar, CMT@TechCharts·
Consider TechCharts Membership- Weekly Global Equity Reports, breakout alerts, Educational Video - Classic Charting. blog.techcharts.net
Aksel Kibar, CMT tweet media
English
105
42
443
0
Aksel Kibar, CMT retweetledi
The Factor Report
The Factor Report@PeterLBrandt·
@MatiasScalbi I've traded futures for 50 years. I have never met anybody who has bet the full Kelly. Betting the Kelly is a myth sold to greedy traders destined to fail. There is ZERO way to trade the full Kelly and have a 6% volatility. You know it and I know it
English
2
1
54
11.2K
Aksel Kibar, CMT
Aksel Kibar, CMT@TechCharts·
Stocks that hold well during market volatility... stock that form tight consolidations right below their strong resistances... will be the first to breakout to new highs when momentum returns. On my radar as it prepares for a breakout #TECHCHARTSMEMBERS Access >> tinyurl.com/4nc9xssy
Aksel Kibar, CMT tweet media
English
4
5
75
9.4K
Aksel Kibar, CMT
Aksel Kibar, CMT@TechCharts·
#TECHCHARTSMEMBERS This cup & handle continuation is setting up nicely. While indices remain volatile, stocks that complete chart patterns in tight ranges will be the first to breakout to new highs when momentum returns. Access >> tinyurl.com/3w3c97jf
Aksel Kibar, CMT tweet media
English
5
2
47
9.4K
Aksel Kibar, CMT
Aksel Kibar, CMT@TechCharts·
A breakdown like this becomes very challenging for those of you who are trading the pattern breakdown/breakout with very tight stops. These end up categorized as Type 3 breakout/breakdown when they reach their price objective. The pattern still keeps its integrity with its guidence on price objective but aggressive trade management could result in a failed trade. Again: bearish pattern completion below the year-long average.
Aksel Kibar, CMT tweet media
English
5
4
70
11.4K
Aksel Kibar, CMT
Aksel Kibar, CMT@TechCharts·
Short setups that complete below the year-long average. Long setups that complete above the year-long average. This is my trend filter. It assures you that you are trading in the direction of the overall trend. From recent #breakdown #alerts
Aksel Kibar, CMT tweet media
English
3
1
75
9K
Aksel Kibar, CMT
Aksel Kibar, CMT@TechCharts·
$COST A Type 1 breakout likely to extend beyond price objective.
Aksel Kibar, CMT tweet media
English
5
2
79
8.9K
Aksel Kibar, CMT
Aksel Kibar, CMT@TechCharts·
There are less Type 1 & Type 2 breakouts and More Type 3 (chop & hard re-test) and Type 4 (straightaway failures) over the past 2 weeks. Very selective market. In such conditions, cutting back on sizing, being more selective on the patterns and strictly respecting stop-loss levels is the way to go.
English
6
4
143
10.2K
Aksel Kibar, CMT
Aksel Kibar, CMT@TechCharts·
$ACWI filled the second gap. 148.8-151.4 support area.
Aksel Kibar, CMT tweet media
English
3
1
61
11.2K
Aksel Kibar, CMT
Aksel Kibar, CMT@TechCharts·
@arsagocak Az pozisyon ile dikkatte almali. Piyasanin nasil degisecegini bilemeyiz. Ayrica para biryere yonelmek zorunda.
Türkçe
2
0
2
488
A R S
A R S@arsagocak·
@TechCharts Merhaba Aksel tamda ona ve benzer bir grafiğe daha bakıyordum. Endeksin böyle riskli zamanlarıda kırılmaları dikkate almalımı yoksa beklemek mantıklı mı ?
Türkçe
2
0
1
586
Aksel Kibar, CMT
Aksel Kibar, CMT@TechCharts·
While constituents of the $URA #ETF weakened over the past week, the chart pattern on $URA is still valid and can be analyzed as an #ascendingtriangle.
Aksel Kibar, CMT tweet media
English
16
14
208
15.3K
Aksel Kibar, CMT
Aksel Kibar, CMT@TechCharts·
Edwards & Magee define symmetrical triangle as a "neutral" chart pattern. In other words it can breakout in either direction and both breakouts can be utilized as a valid signal. I've incorporated an overriding trend filter which is the 200-day average for equities. Any breakdown signal that takes above the year-long average, I do not participate. I see this as a position against the overall trend. $NXE
Aksel Kibar, CMT tweet media
English
8
5
160
16K
Aksel Kibar, CMT
Aksel Kibar, CMT@TechCharts·
@EzraTrading I use 365 days average for crypto. It is a coincidence that price touched the 200-day. Earlier rejection was from the 365 days. We can't optimize this. One way or another long-term average can be used as a trend filter, not a level for trading decision making.
English
5
1
4
260
Ezra
Ezra@EzraTrading·
@TechCharts Hello Aksel, when analyzing BTC does the 200-MA still hold any significance to you? I noticed the rejection of the upper boundary of that channel is coupled with the 200. Thank you.
English
2
0
1
155
claudio de toma
claudio de toma@claudiodetoma1·
@TechCharts Hi, XOM has violated this H&S pattern. It will continue its uptrend following the geopolitical and rising inflation narrative. What do you think?
claudio de toma tweet media
English
1
0
4
721
Aksel Kibar, CMT
Aksel Kibar, CMT@TechCharts·
#SPX potential for a pullback towards 7,040 horizontal support.
Aksel Kibar, CMT tweet media
English
11
19
287
20.7K