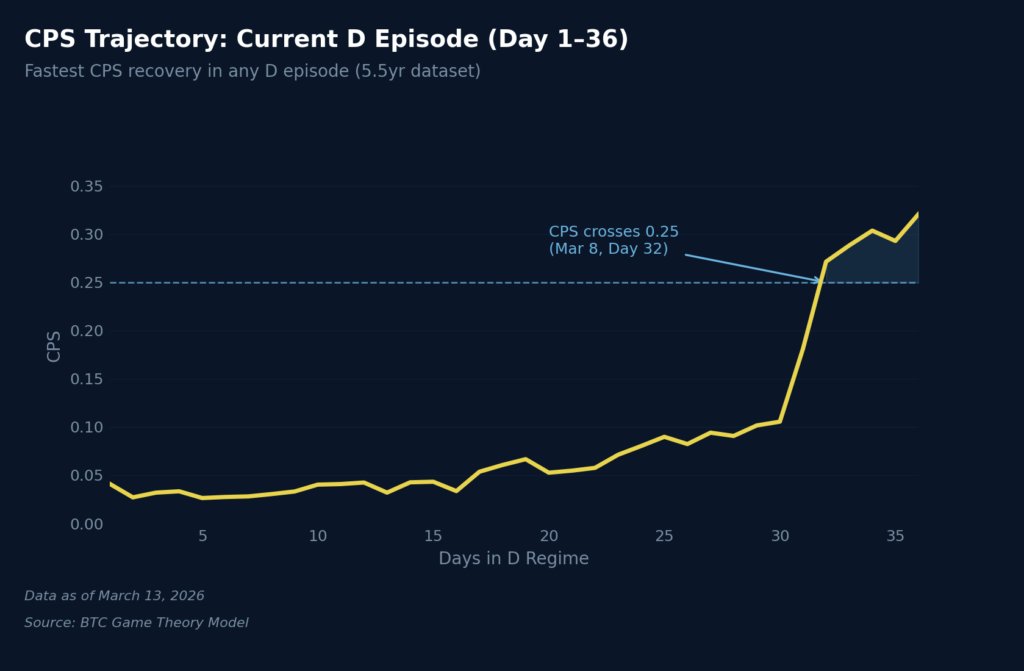

Our analyst @that1618guy built the Game Theory Rainbow Chart which identifies when Bitcoin players are coordinating to accumulate and when they're acting in self interest. It breaks into two regimes. Cooperation is when volatility drops, long-term holders start tilting up and exchange balances go down. Players are working together to keep price low and buy more. Defection is the opposite. Volatility spikes, whale inflows pick up, funding and open interest stay elevated. What's interesting is how differently these regimes behave. Defection burns out fast. Cooperation is sticky. Once it takes hold, the longer it runs the more likely it continues. Right now we're 25 days into a defection regime which is unusually long. On the chart, green zones represent cooperation. Orange zones represent optimized cooperation regimes that have persisted long enough to signal durability. Historically these have been the most attractive periods for allocation.