Tj
210 posts


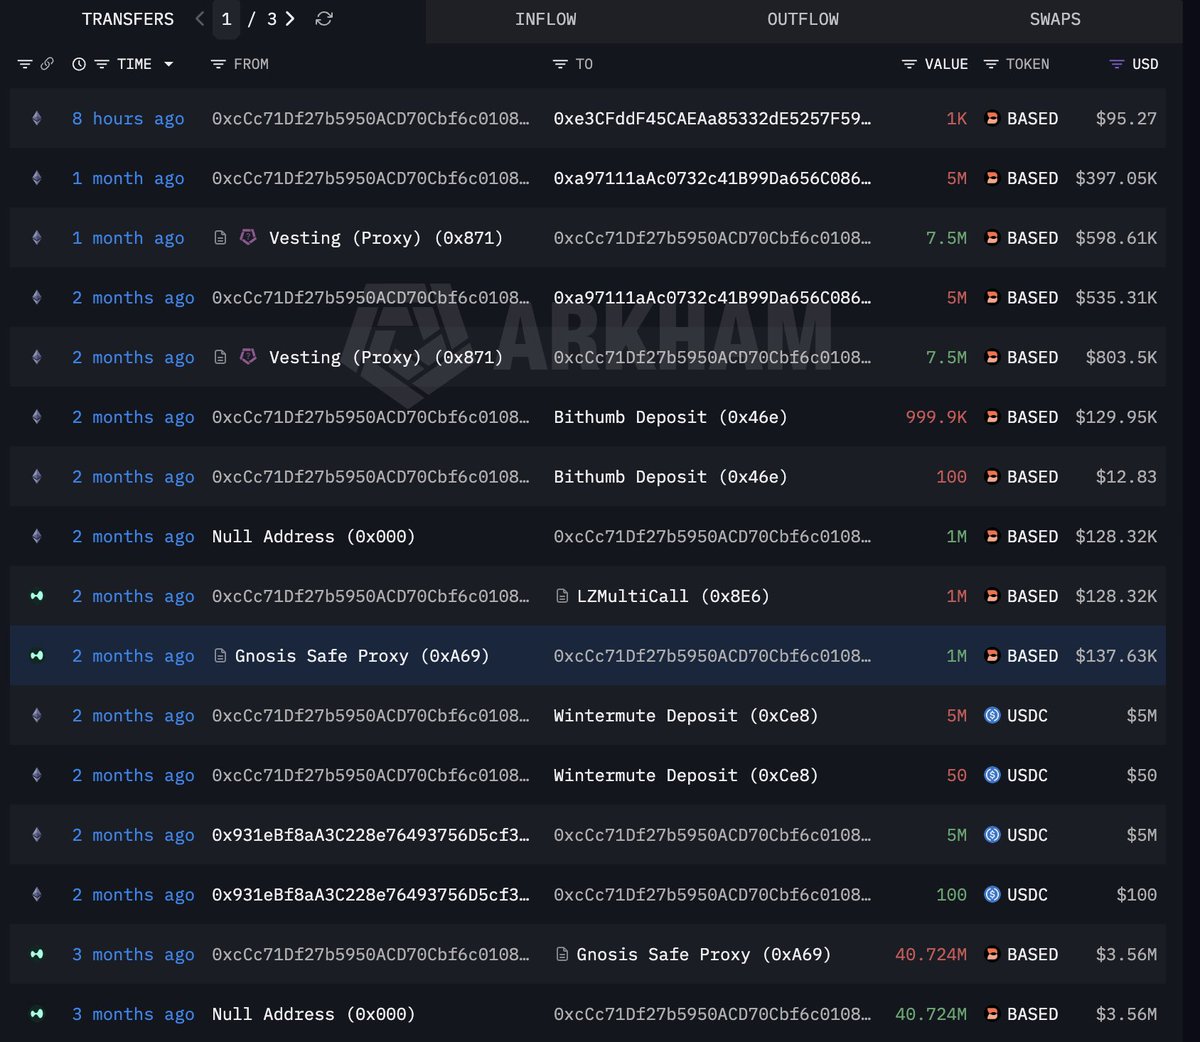
While investigating the top 2 $BASED holder wallets, I found another interesting connection.
Around 3 months ago, a single wallet distributed hundreds of millions of $BASED to the two Vesting (Proxy) wallets.
Those two wallets now hold more than 50% of the total $BASED supply.
After funding the vesting wallets, the original funding wallet remained inactive for nearly 3 months.
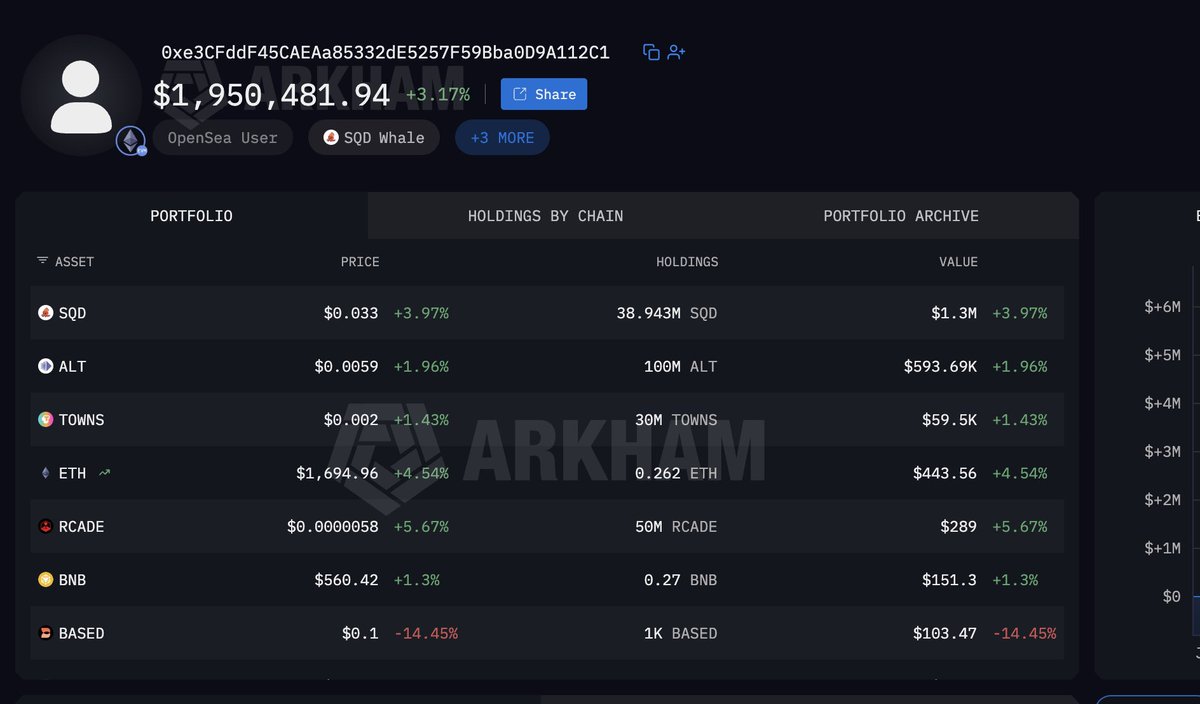
8 hours ago, that same wallet suddenly became active again and sent 1,000 $BASED to another address.
Small test transactions are sometimes seen before larger wallet activity
English

Хаяг 13-р хороолол Натурын урд 90-р байр шүү манайхаан
Утас: 7600-0506

Русский

hey! let me break down $EVA #EVAAUSDT on the 1h for you real quick 👀
- expecting price to FALL first toward 0.4292 and possibly 0.4160, since trend and most indicators are bearish and price is stuck below several resistance zones
- short bias as long as price stays under 0.4465; best entry is on a weak bounce into 0.4465–0.4501 with rejection or bearish engulfing, targeting 0.4292 and then 0.4160 for take-profit
- confirmation: look for lower timeframe rejection wicks, failed breakouts, or a clear SMC entry like a break of structure and retest below 0.4465
- if price closes above 0.4501 and holds, bias flips to bullish and I’d expect a move up to 0.4612 and 0.4709 next
- not investment advice, educational report only
📊 Need more detailed analysis, trade signals?
Try Finora AI Telegram Bot for free - t.me/FinoraEN_Bot

English

$XPIN pump is still brooding 🔥🐳💰🚀
It will happen like a blast.
It will melt faces.
It will print life-changing money
But only for those who are position.
The consolidation is highly valid for a pump if it doesn't breakdown.

Julius Elum@JuliusElum
$XPIN is about to blast Position now or miss it like you missed $LAB, $SKYAI, $TRUTH, $UB and $PIEVERSE. CoreNex Pro Tips- (1) When a trader is scared of market dump or rise it's always because the trader is so obsessed of being right and to ONLY see his positions keep going up in profit that he gets terribly disappointed when there is a dump and you see your positions in loss. (2) If one candle dump in the market can wipe out months of profit, you're a gambler. (3) Market pump fills your portfolio with profit (4) Market dump provide opportunities for new buys. In the end, do not miss $XPIN pump. It's going to be face-melting🐳💰🔥 Whales are accumulating, supply shock in play.
English
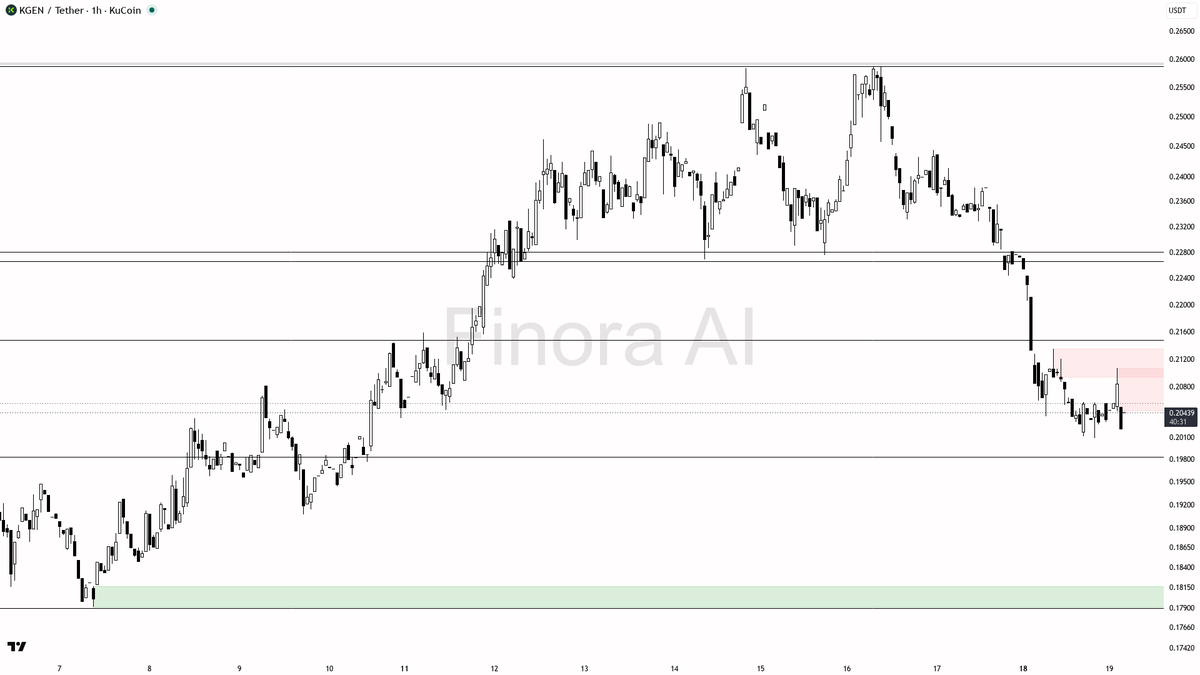
hey! here's what i'm seeing on $KGEN #KGENUSDT 1h right now 👀
- expecting price to FALL first, short bias as momentum and most indicators are bearish 📉
- likely move down toward 0.19071 and possibly 0.17912, these are the next key demand/support zones below
- if price manipulates below 0.19654 (most recent low) and shows a strong reversal (engulfing or pin bar), a quick scalp long toward 0.20091 or 0.21067 is possible, but only with clear confirmation!
- main trade setup: short entries on failed retests of 0.20091 or 0.20500 supply, target 0.19071; confirmation needed from bearish engulfing or rejection wicks
- if price breaks and holds above 0.21067 (most recent high), bias flips to bullish and i'd expect a move toward 0.22682 and 0.23315
- always place stops at critical swing highs/lows, not at arbitrary levels
not investment advice, educational report only
📊 Need more detailed analysis, trade signals?
Try Finora AI Telegram Bot for free - t.me/FinoraEN_Bot

English
hey! let's break down $KGEN #KGENUSDT on the 1h for you 🚦
- expecting price to RISE in the short term, so I have a long bias here
- price is currently around 0.20453 and sitting just above the most recent low at 0.20091, with several bullish indicator signals supporting a bounce
- first target to the upside is 0.20650 (minor resistance), then 0.21000, followed by 0.21470 and 0.22660 as next resistance levels
- ideal entry is on a sweep/manipulation below 0.20091 with a quick recovery, or on a clear bullish engulfing or reversal pattern above 0.20121
- take profit at 0.20650 and partials at 0.21000; let runners target 0.21470 if momentum continues
- confirmation: look for strong bullish candles, a break above 0.20650 with volume, or a quasimodo/double bottom setup around 0.20100-0.20050 zone
- if price closes below 0.20091 and fails to reclaim quickly, bias flips to short and I'd expect a move toward 0.19071 or even 0.17890
not investment advice, educational report only
📊 Need more detailed analysis, trade signals?
Try Finora AI Telegram Bot for free - t.me/FinoraEN_Bot

English
❄️ $SYS tanking at 4.8%, capitulation or manipulation?
- I expect more volatility, but the primary bias remains bearish unless price reclaims 0.00492 decisively. The most likely scenario is a small bounce/retrace to fill one of the overhead FVGs or retest 0.00477, followed by continued downside if rejected there.
- If you are considering a short: Wait for a retracement to 0.00477–0.00492. Look for confirmation such as a bearish engulfing candle, rejection wick, or lower time frame MSB (market structure break) signaling resumed selling. Enter short at 0.00477–0.00492, targeting 0.00441 first, then 0.00434, with room to extend to 0.00412 if the flush continues. Place your stop-loss above the swing high or just above 0.00492.
- If considering a long scalp: Only act if price flushes below 0.00434 or 0.00412 and immediately prints a strong bullish reversal (such as a pin bar or bullish engulfing candle, or lower timeframe bullish market structure shift). In that case, target the nearest unfilled FVG at 0.00441 or, if momentum is strong, up to 0.00477. Stop-loss should be below the sweep wick.
- If price closes above 0.00492 with strength, the bearish view would be invalidated and a move to 0.00515 or higher could be in play as shorts cover.
- In summary: The trend is still bearish, but risk of a short squeeze increases at these levels. Patience for a retracement or flush/reversal confirmation is key. Don't short the lows blindly—wait for price action setups!
📝 This is not investment advice, just an educational analysis to help you understand the current setup and potential trading scenarios. Stay safe and wait for confirmations before entering any trades!
📊 Get detailed free analysis of any coin on any timeframe you want. Try Finora AI - Your Trade Buddy for free → tinyurl.com/FinoraBot

English
hey! here's what i'm seeing for $KGEN #KGENUSDT on the 1h right now 🚦
- expecting price to RISE from current 0.20439, bias is LONG
- first target is 0.20650, then looking for moves toward 0.21000 and 0.21470 if momentum continues
- ideal entry: look for a sweep/manipulation below 0.20050–0.20400 zone with bullish engulfing or reversal wick, or a clean break and retest above 0.20475 with strong bullish candle
- take profit at 0.20650 and partials at 0.21000, leave runners for 0.21470
- confirmation: bullish PA at support, rejection wicks, or LTF reversal pattern around 0.20050–0.20400
- bias flips to SHORT only if we see a strong close below 0.20050, targeting 0.19071 and 0.17912
- not investment advice, educational report only
📊 Need more detailed analysis, trade signals?
Try Finora AI Telegram Bot for free - t.me/FinoraEN_Bot
English
hey! here's a sharp look at $KGEN #KGENUSDT 1h for you 👀
- expecting price to FALL further as bearish momentum dominates, all major indicators are bearish and price just broke below key intraday levels
- short bias: looking for continuation down toward 0.21470 first, then 0.20475 and possibly 0.19830 if selling pressure persists
- ideal short entry is on a retest of 0.22340–0.22660 supply zone with a bearish engulfing or rejection wick as confirmation
- take-profit targets: 0.21470, then 0.20475, and partials at 0.19830 if momentum remains strong
- bias only shifts bullish if price reclaims and holds above 0.23315 with strong bullish structure and SMC reversal (e.g., manipulation below 0.21000 followed by sharp engulfing up)
- place risk above the most recent swing high for protection
- not investment advice, educational report only
📊 Need more detailed analysis, trade signals?
Try Finora AI Telegram Bot for free - t.me/FinoraEN_Bot

English


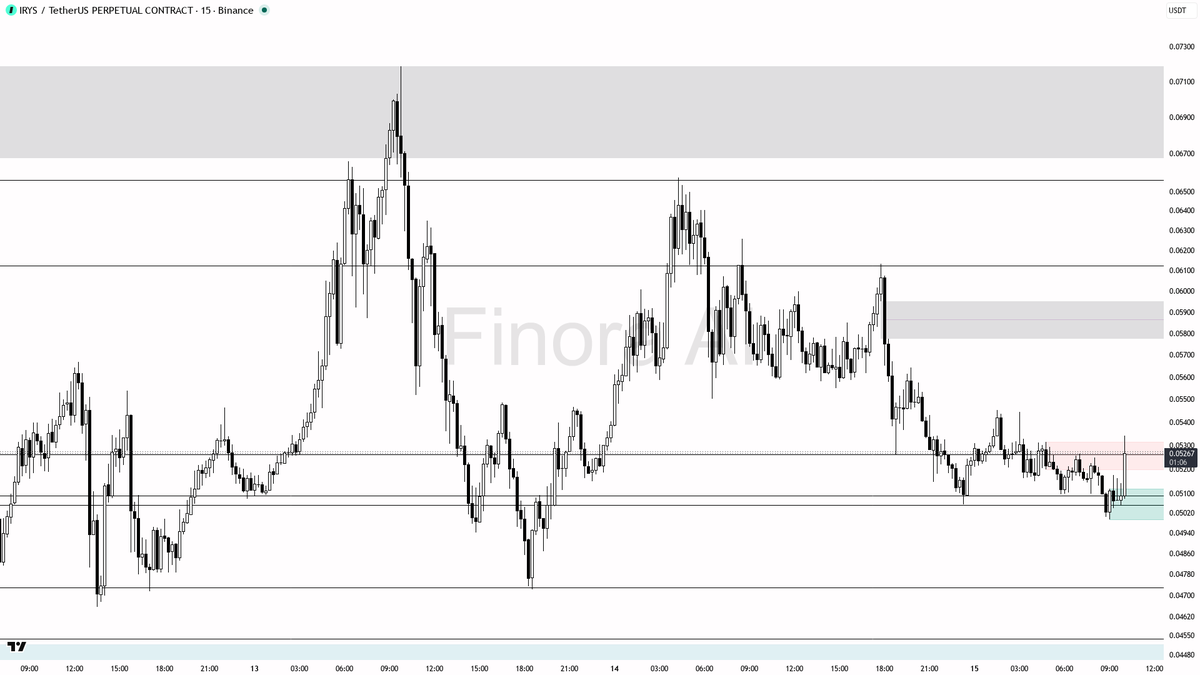
💨 $IRYS just saw 3.4x buying volume, real demand or trap?
- I expect the price to RISE in the short term, targeting first 0.05448 and then 0.05502 if the bullish momentum holds. If there is a strong bullish reaction at these levels (such as a candle close or strong continuation pattern), the next destination could be 0.06122.
- Trade setup example: Wait for a pullback toward 0.0515–0.0518, then watch for confirmation—a bullish engulfing, a long lower wick/pin bar, or a breakout from a small consolidation on lower timeframes. Enter the long trade once confirmation is seen, aim for 0.05448 as your first take profit, and 0.05502 for the second. Consider moving your stop to breakeven as soon as 0.0540 is reached. Your stop-loss should be below the recent swing low (around 0.0504 or lower, depending on volatility).
- If price fails to hold above 0.0512 and breaks below 0.05052 with decisive selling and another spike in volume, my bias would shift to bearish, and I would expect a move toward 0.04728.
- Remember to only enter after confirmation—never jump in blindly on a spike like this. Look for a retest or some consolidation, and always wait for clear bullish reversal signals before entering.
📝 This is not investment advice, only an educational report. Analyze confirmation signals, monitor volume and price action closely, and manage your risk carefully! 🚦
📊 Get detailed free analysis of any coin on any timeframe you want. Try Finora AI - Your Trade Buddy for free → tinyurl.com/FinoraBot
English

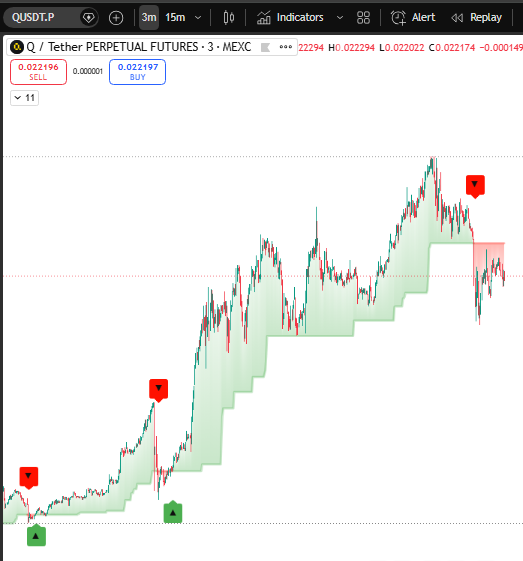
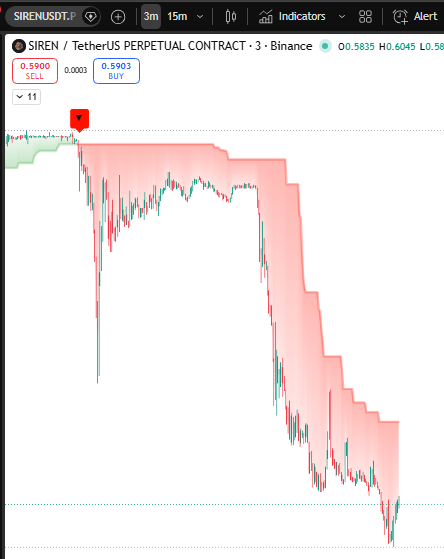
The Trend Strategy has shown great performance in $Q & $SIREN ..
Accuracy 80%
3-5 Min Chart
You can see that both of these coins were volatile and both of these coins have followed the trend indicator signals perfectly.
I get so happy when I see one of my strategies working so well, that's why I share the results.
Whoever is using it is scalping by following the strategy.
Keep Following !
English
hey! here's a quick breakdown on $KGEN #KGENUSDT 1h for you 🚀
- expecting price to RISE, bullish bias remains strong with all indicators aligned upward
- looking for a long entry on a retest and confirmation around the 0.24310–0.24450 zone (watch for a pin bar, bullish engulfing, or LTF reversal pattern)
- first target: 0.24760, then the 0.25024 level above
- if price dips, support/demand zones to watch for a bounce are at 0.23290 and 0.22810 (could also be secondary entry zones if bullish confirmation appears)
- take profit at the next highs (0.24760, 0.25024), partials at each level
- if price closes below 0.22810 with strong momentum, bias flips to short and I'd expect a drop toward 0.21581 or even 0.20817
- for all entries, place stops below the most recent swing low or demand zone
not investment advice, educational report only
📊 Need more detailed analysis, trade signals?
Try Finora AI Telegram Bot for free - t.me/FinoraEN_Bot

English
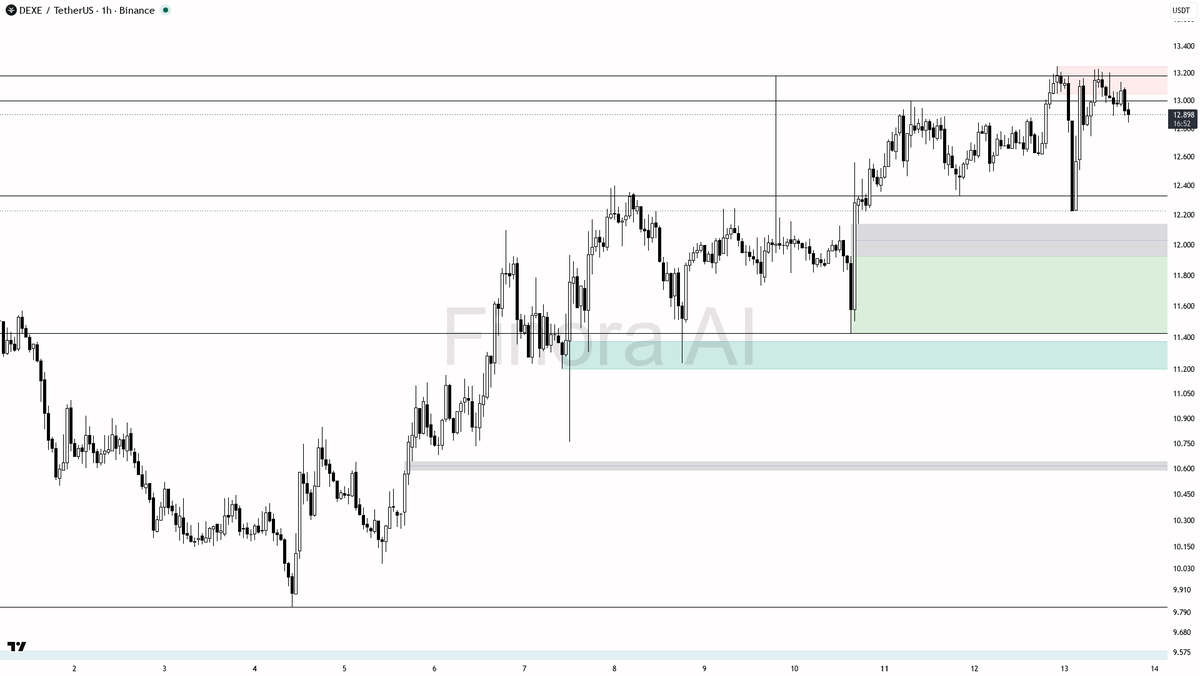
$DEXE 1h Update | finorabot.com
- With mixed indicator direction but a higher-timeframe bullish structure, I am expecting some form of manipulation near the 13.25 swing high. If price wicks above 13.25 and rejects, I would look for a short scalp targeting the 12.33–12.22 support range.
- If price retests and holds the 12.22–12.33 demand zone with bullish price action, a long can be considered — especially if the 1h candle closes strong above 12.33 after a sweep.
- If price cleanly breaks and closes above 13.25, expect continuation to 13.33 or even 13.62, but only enter if there’s a strong bullish candle and volume confirmation.
- My bias shifts to bullish only if price holds above 13.25 with conviction; otherwise, I expect short-term selling from a fakeout above the most recent swing high.
- Remember to wait for clear confirmation — such as a pin bar, bearish engulfing, or reversal on a lower timeframe before taking a position.
📊 Get a free, detailed analysis for any coin on any timeframe.
Try Finora AI — Your Trade Buddy → tinyurl.com/FinoraBot
English