Sabitlenmiş Tweet

Top Performers in US Stock Market since 2000
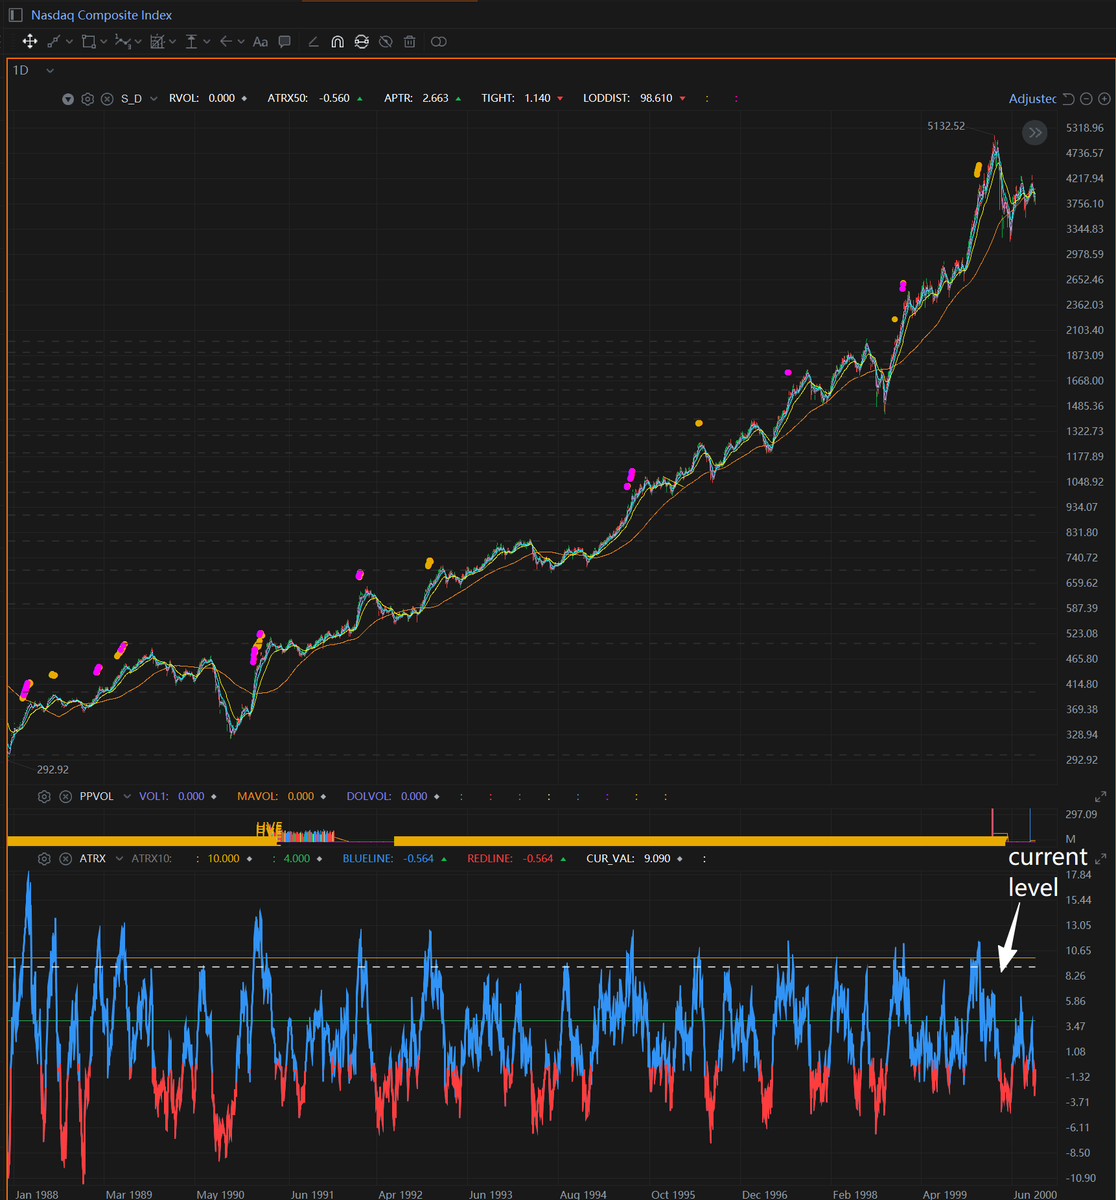
I want to share a self-hosted stock research tool that identifies and visualizes the most powerful price moves in US equity market from 2000 to current date. It processes raw daily OHLCV data for over 12,000 US tickers — including delisted stocks — and surfaces the top 7% performers each year for in-depth chart study.
Github link: github.com/willhjw/big_mo…
The project is inspired by the trading methodology of Kristjan Kullamägi (Qullamaggie), which focuses on learning from stocks that made exceptional gains in a short period of time. By studying these historical moves in detail — their price structure, volume behavior, and timing — traders can develop a sharper eye for recognizing similar setups as they form in real time.
This is also a use case for my open-source charting platform. github.com/willhjw/ib_cha…
If you find this project helpful, welcome to buy me a coffee. buymeacoffee.com/willhu
Disclaimer
Stock data and any statistics or charts derived from it are not guaranteed to be 100% accurate or complete. You are responsible for independently verifying the accuracy and suitability of the data before using it for any purpose.
Will Hu@traderwillhu
Thanks to AI coding, a complex learning process is now much simpler. I filtered the top 7% YTD stocks from 2000–2026 (including delisted ones), get 1400+ stocks, and visualized them with TradingView Lightweight Charts, featuring auto-marked highs/lows and direct period displays. Browse by year or symbol, even delisted stocks from the last decade like $LVGO and $TWTR are fully accessible. Once I refine the charting and annotation features, I will open-source this learning project.
English