
@Redkiraz @dominiksteiger no, but interesting. in zurich, it also looks like its higher shedding per reported clinical case now:
English
...
2.2K posts


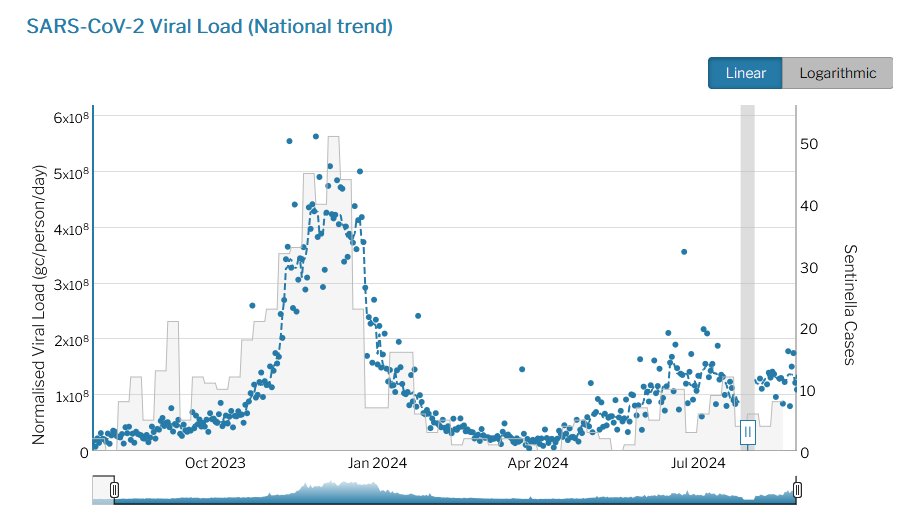
First evidence indicating the JN.1 variant (and BA.2.86) are linked to higher fecal shedding than prior #SARSCoV2 variants thelancet.com/journals/lanin… @TheLancetInfDis Aligns with extremely high wastewater levels that were seen at peak JN.1 wave

Some bottles of water contain hundreds of thousands of tiny plastic fragments per liter, which is up to 100 times more than previous estimates, a new study found. @CelineGounder joined @CBSMornings to discuss how it could impact your health: cbsnews.com/video/a-new-st…
INTERESTING INFORMATION in the Washington Post Article : "A measure of standard deviations above the baseline re-calculated every every January and July using the past year of data" 🤔

