TWE

953 posts

TWE banner
TWE

TWE

@twecharts

Taking a different approach in the markets using Cycle Analysis.

Katılım Ekim 2021
9 Takip Edilen10.2K Takipçiler
TWE
TWE@twecharts·
@holypopcornNFT 30 just joined in the last 5 minutes so discord is temporarily hiding the channels. Should be resolved soon.
English
0
0
2
345
Holypopcorn
Holypopcorn@holypopcornNFT·
@twecharts Hey, thanks for the hangout! It says we're not authorized to see any channels :D
English
1
0
0
320
TWE
TWE@twecharts·
Hey everyone, decided to make the Discord FREE and open to everyone. If you’ve ever watched my videos or followed my posts, come hang out. 🚀 discord.gg/tw2MmAENE
English
7
2
27
3.4K
TWE
TWE@twecharts·
November looks fun. #AMC
TWE tweet media
English
40
22
267
20.7K
JustMe
JustMe@JuniorsFinest24·
@twecharts I have yet to see a fractal pattern play out when lined up like this.
English
1
0
16
1.5K
TWE
TWE@twecharts·
$GME now vs $AMC in 2021
TWE tweet media
English
20
24
434
35.1K
TWE
TWE@twecharts·
“fRaCtaL$ dOn’T wOrK bRoOoOo” #AMC #GME
TWE tweet media
English
11
5
131
9.6K
TWE
TWE@twecharts·
Another massive $SPY move! Caught this thanks to Plotsy’s advanced reference pattern detection, which highlighted a high probability setup in real time. These reference patterns are changing the game. 🔥
TWE tweet media
English
3
2
12
3.9K
TWE
TWE@twecharts·
Full win streak today 3/3 🔥 right before #AMC earnings. Markets about to get interesting!
TWE tweet mediaTWE tweet mediaTWE tweet media
English
5
6
67
4.8K
TWE
TWE@twecharts·
Reverse splits artificially alter price structures which distort patterns and key levels so here’s a better representation of the #AMC chart with its original $72 high.. Also current fractal tracking looks good for a continuation, just broke it down live on YouTube.
TWE tweet media
English
12
7
158
12.7K
TWE
TWE@twecharts·
#AMC is up +20% since bottoming. This micro spring setup is following the reference pattern on yesterday’s post closely, which would complete a +50% move before hitting resistance. If it keeps mirroring, we could see a similar trajectory unfold. Macro is a whole different story.
TWE tweet media
English
19
17
199
15.2K
TWE
TWE@twecharts·
The reference pattern on the right suggests an #AMC bottom is in. It signals continuation, eventually leading to a breakout from the longest accumulation period in AMC’s chart history.
TWE tweet media
English
17
28
290
14.9K
TWE
TWE@twecharts·
Why #Bitcoin is going to $275K? Give my live stream from 2023 a watch! It’s all coming together, as planned.. 🚀
English
5
3
27
5.9K
TWE
TWE@twecharts·
#AMC is up +8% today and trading inside a POI window. 🤷‍♂️
TWE tweet media
English
11
11
200
13K
TWE
TWE@twecharts·
I can say with certainty, finding volatility windows (POIs) is not difficult. The tricky part often times is direction. This week on the discord all POIs hit 🎯 $LCID was the only POI that played out inverse.. why it’s sometimes a good idea to use strangle options.
TWE tweet mediaTWE tweet mediaTWE tweet mediaTWE tweet media
English
3
4
16
4.5K
TWE
TWE@twecharts·
It’s been two years now and the AMC vs ARPA pattern continues to track. Take a look at how much volatility there is at the end of ARPA’s sequence. #AMC is getting real close man.
TWE tweet media
English
12
3
105
10.4K
TWE
TWE@twecharts·
This is why I love using #AMC fractals as reference patterns for other stocks. $FUTU rallied +100% in just two weeks! 🔥
English
4
6
50
7.7K
TWE
TWE@twecharts·
Market Cycle Analysis: Indicators Two years ago ‘CopyPat’ predicted the markets had reached their bottom, it also predicted that $SPY would reach $560 in July of this year, which it did.. How? - Harmonic Cycle Patterns: The indicator recognizes reoccurring patterns and cycles in the market. - Statistical Validation: The indicator filters out noise and focuses on significant trends. - Adaptability to Market Changes: The indicator can adapt to different market phases, making it understand the trading environment.
TWE@twecharts

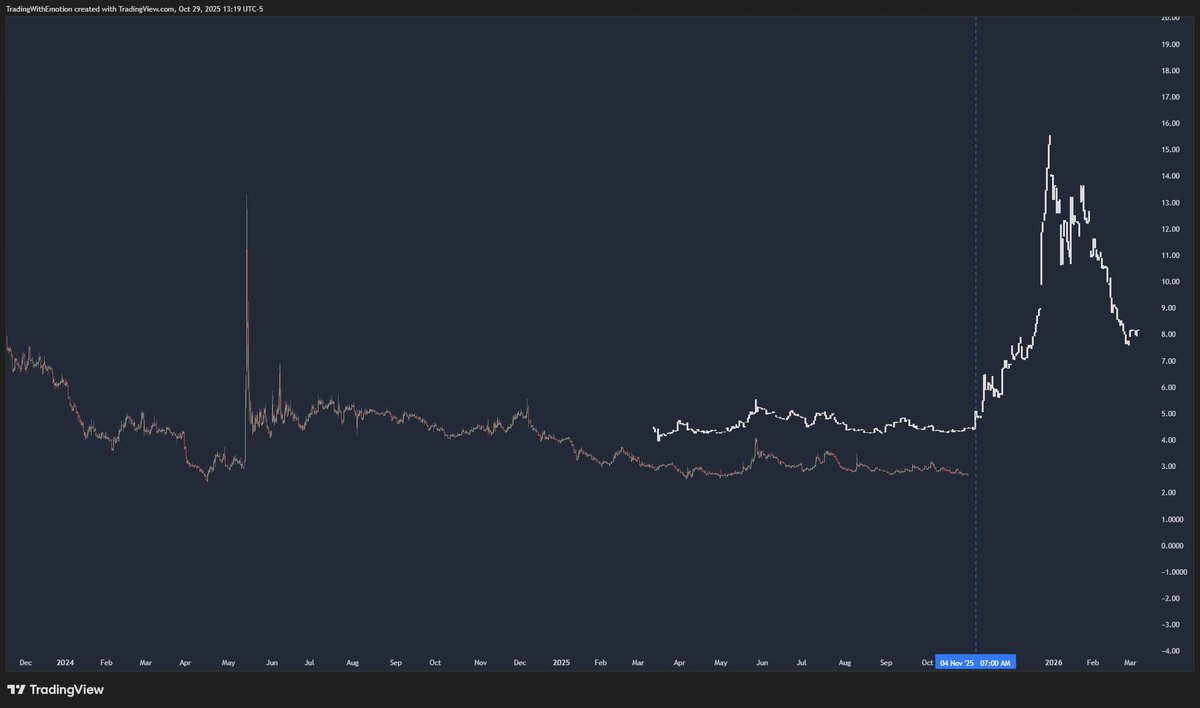
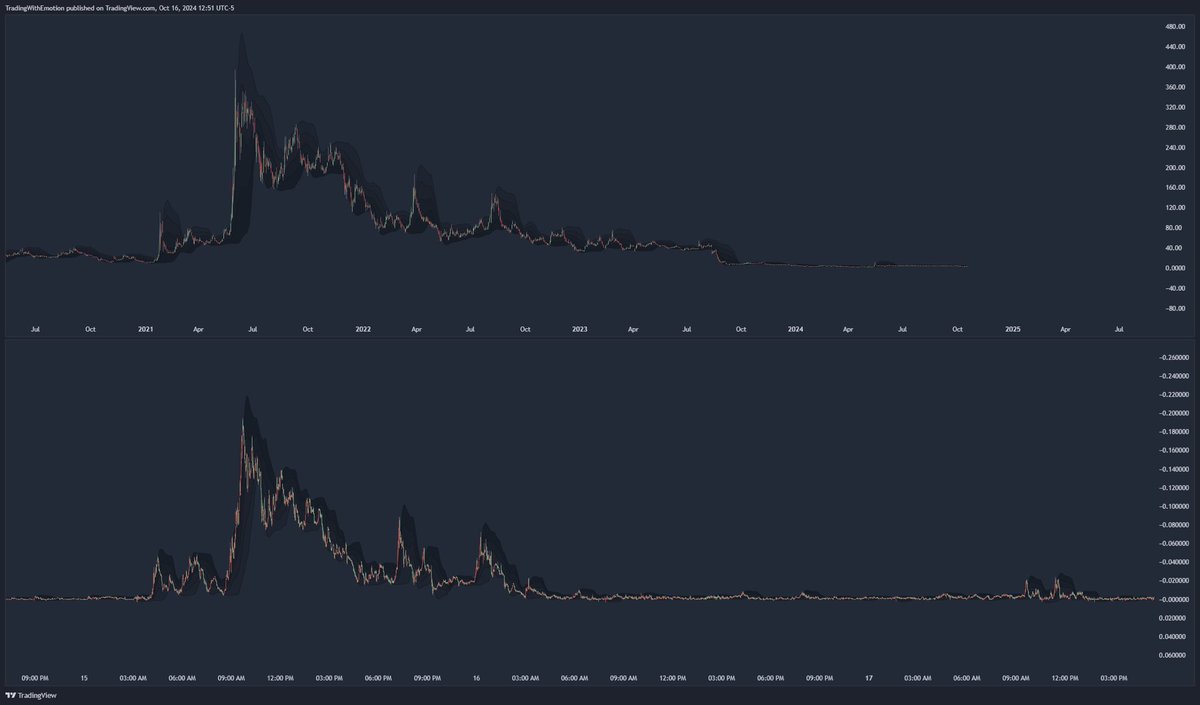
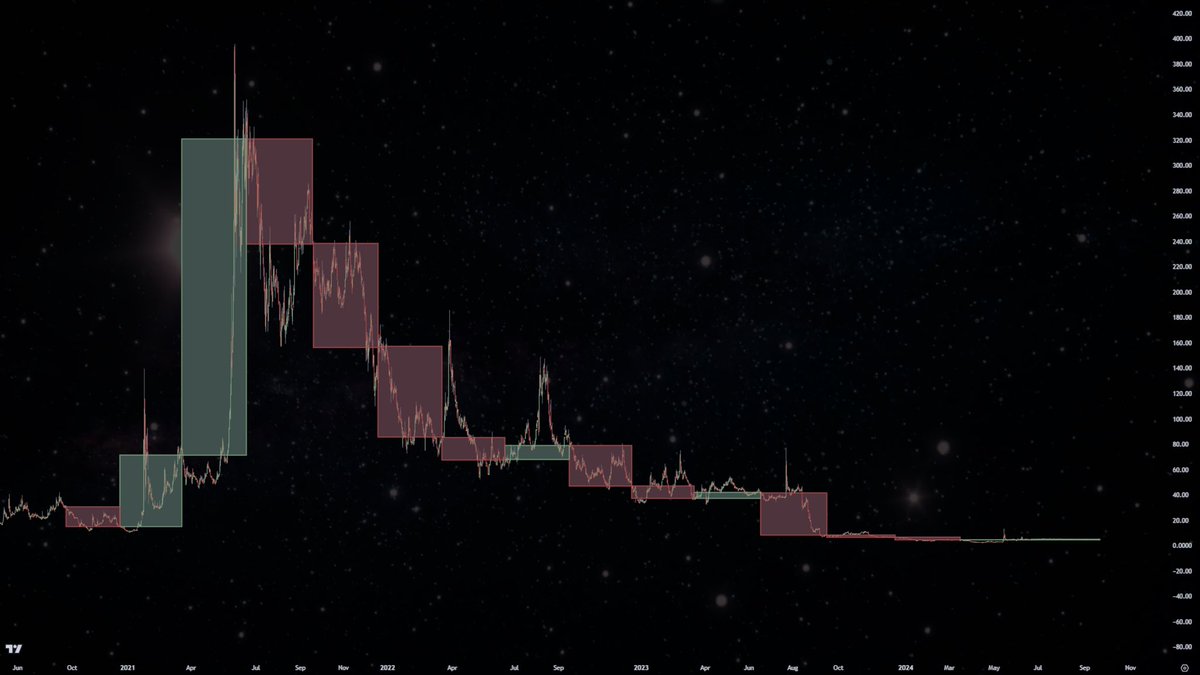
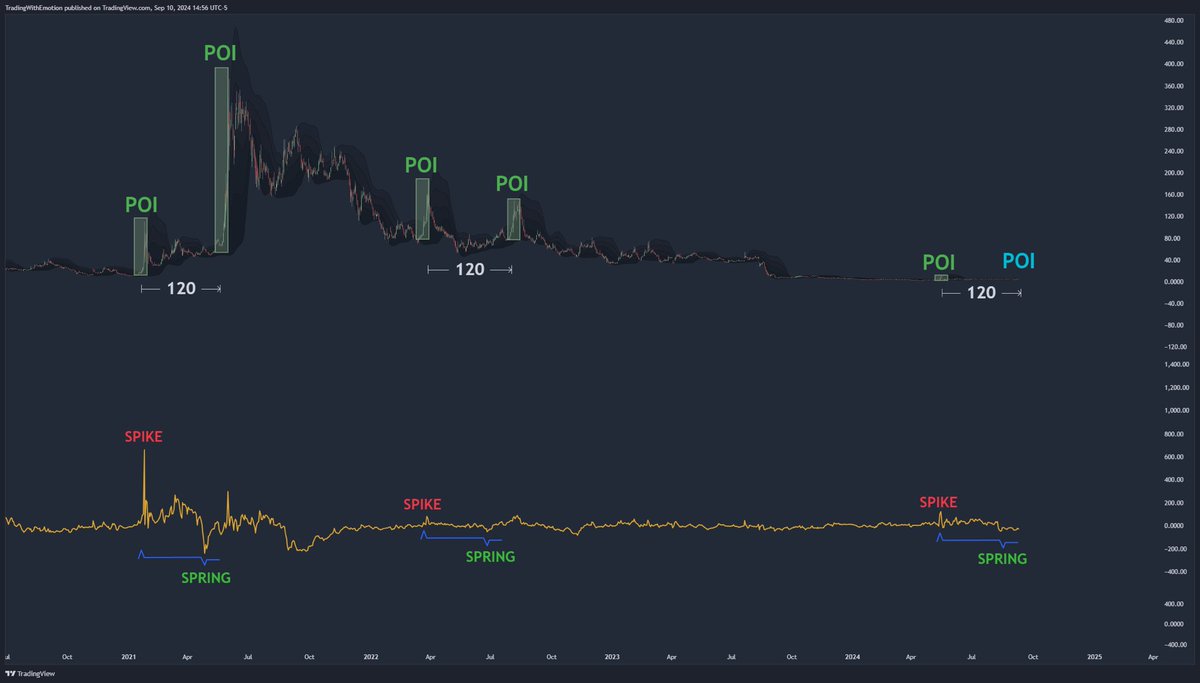
$SPY Spots indicator on the weekly chart getting close to resistance (pink curve), a blue spot on the weekly chart will rally the markets $AMC $GME. Here is the CopyPat indicator projecting that move.

English
6
3
16
5.5K
TWE
TWE@twecharts·
For the first time in three years, #AMC is giving us two green quad witching candles back to back. Meaning the trajectory remains bullish. 📈
TWE tweet media
English
14
28
240
23.4K
TWE
TWE@twecharts·
Analyzing the current #AMC cycle, we see a 120 day consolidation period that starts with a spike and ends with a spring. Not all cycles have these qualities, which makes this POI more significant.
English
8
15
160
16K
TWE
TWE@twecharts·
#AMC If you take the FFT you’ll see that every positive POI has this in common: a spike followed by 120 days of consolidation. If a spring forms 90 days after a POI the next one is statistically more likely to be a positive one. Video out soon.
TWE tweet media
English
7
7
87
6K