Varun
723 posts


Varun
@varunn16_
I study markets, behaviour, people, psychology, cycles; all of it. Trader - Investor, with zero chills beyond equities. I am the next multibagger!
Katılım Mayıs 2024
32 Takip Edilen36 Takipçiler
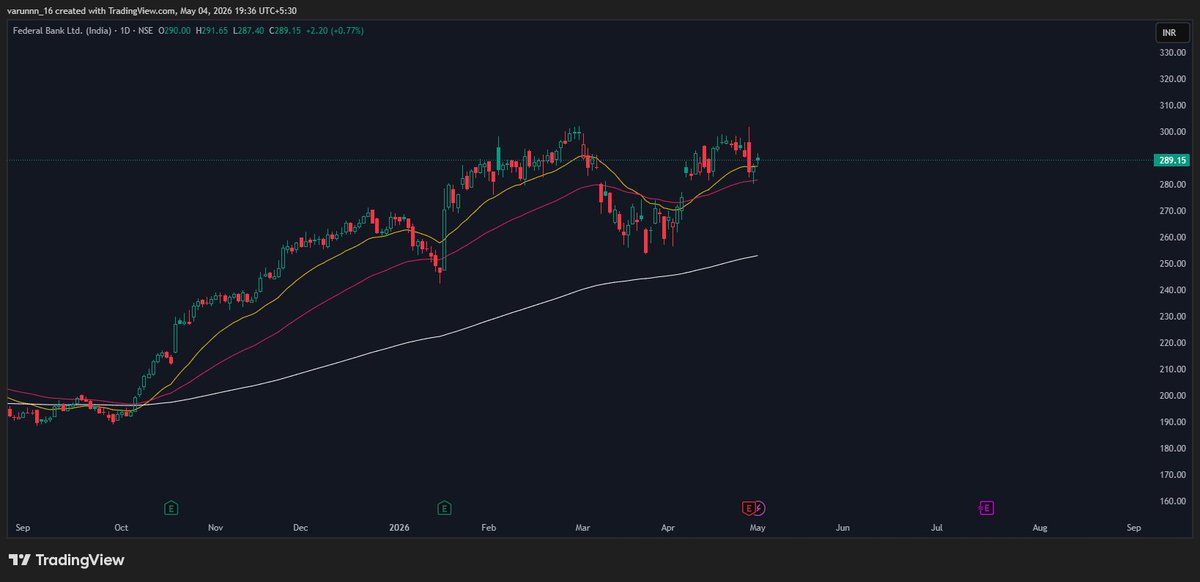

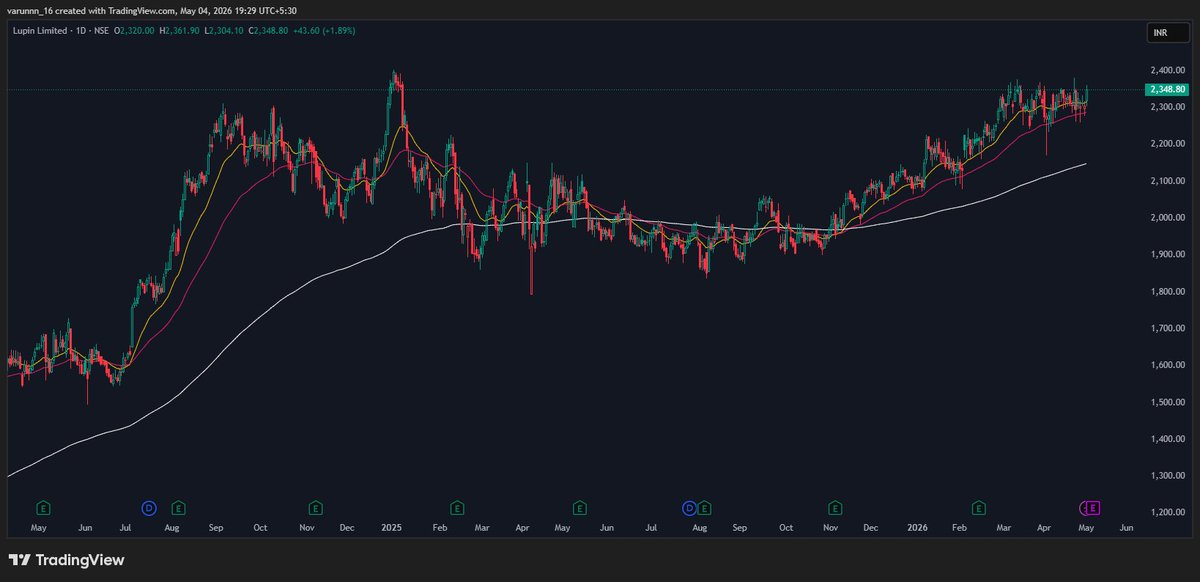
Most traders wait for the breakout.
But the lower-risk and often more profitable trade is usually the reversal after the breakout.
Once a strong stock breaks out, it often pulls back to retest:
- the 10 EMA
- the 20 EMA
- previous resistance, now acting as support
That retest is where the better entry usually is.
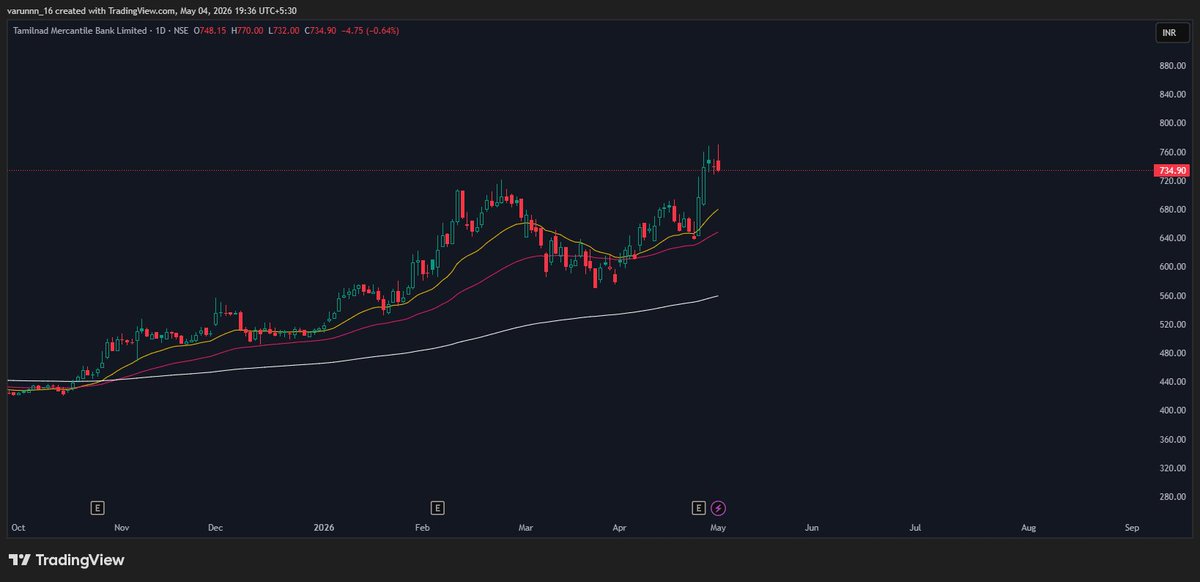
Especially when:
- results are already out
- the earnings were strong
- the stock belongs to a leading sector
- price respects the 10/20 EMA on pullback
Breakouts get attention.
Reversals offer better risk-reward.
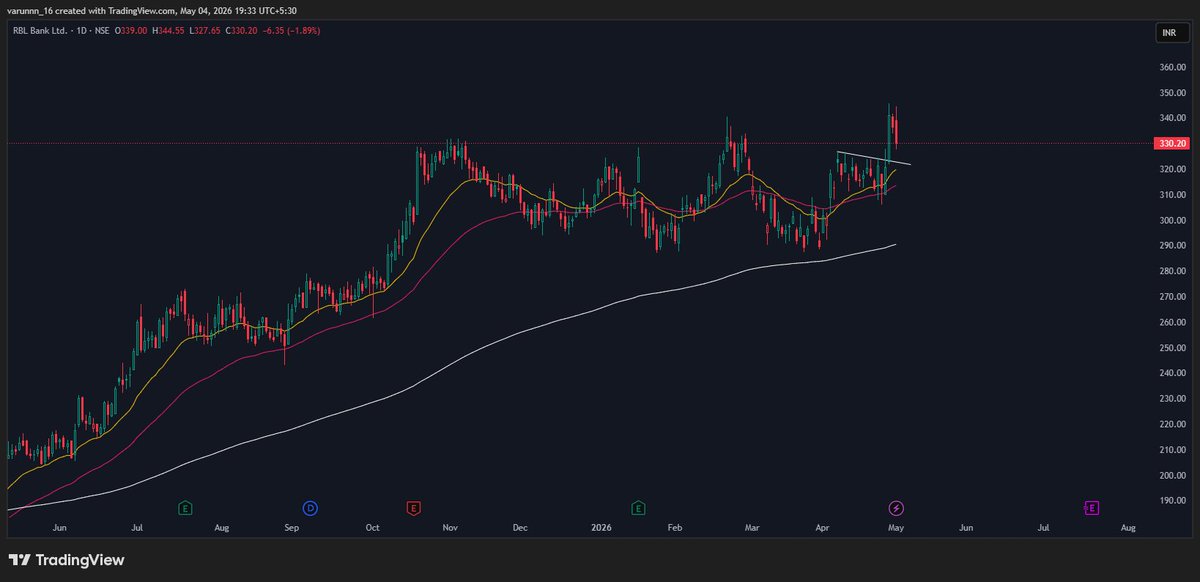
Something similar seems to be happening in RBL Bank
English

The May ISM print drops in early June. The sub-components to watch are employment, prices, and new orders in that order.
If employment stays below 47 while prices stay above 75 and new orders hold above 53, the stagflation read gets stronger. If new orders drop sharply — which would suggest the pre-buying thesis was right — the picture changes quickly and the recession risk becomes real for different reasons.
English
Where this entire read could be wrong.
If the Iran war ends materially faster than markets expect, oil falls, the prices index collapses, and the Fed gets room to cut. The stagflation thesis disappears. The data reverts toward a normal mid-cycle slowdown and the conversation becomes about the pace of recovery, not the shape of the risk.
The Iran war trajectory is a more important variable for this thesis than any upcoming PMI print. If you are tracking this situation, watch oil and the geopolitical calendar before you watch the economic calendar.
English
Most people look at a stock only after it has already made a big move.
That is usually where the risk is highest.
What interests me more is what happens after the move.
After every meaningful expansion in price, the market usually goes through a period of contraction. Price tightens. Volume dries up. Volatility reduces. The stock becomes quiet.
To most people, that looks like “nothing is happening.”
But that silence is often where the next big move begins.
This is one of the most repeatable behaviours in markets:
Expansion → Contraction → Expansion
A strong move gets attention.
A controlled pullback removes weak hands.
A tight base builds.
Then the next move begins.
Now, contraction alone is not a buy signal.
It is simply the market telling you: pay attention.
This is where the real work starts.
Once a stock enters that phase, the next step is to study:
1. Is price respecting structure?
2. Is volume contracting in the base?
3. Is supply getting absorbed?
4. Is the stock holding up better than the market?
5. Is there a fundamental trigger that can fuel the next leg?
That trigger could be:
- Earnings growth
- Margin expansion
- Sector tailwinds
- A business inflection
- Institutional accumulation
And yes, sometimes stocks move even without obvious triggers.
But when technical contraction and fundamental expansion begin to align, that is where asymmetric opportunities are created.That is where the best trades usually come from.
This principle is not new.
It worked 50 years ago.
It worked 100 years ago.
It will likely work 500 years from now.
Because markets change.
Human behaviour does not.
Fear, greed, doubt, conviction — these cycles are permanent.
And if you learn how to identify contraction properly, you stop chasing extended moves and start finding high-upside opportunities with lower-risk entries.
That is where big winners are usually found.

English
The 1.92 trillion rupees of FPI outflows is not a sign of weakness in India. It is actually a creation of capacity. When foreign portfolio investors do eventually return, they will be stepping into positions that domestic institutional investors have already accumulated at distressed valuations.
English
FPI re engagement with India does not require India specific catalysts. What it requires is broader macro stabilization in three areas. First, oil needs to fall below 90 dollars per barrel when it is currently at 102 dollars. Second, US Treasury yields need to decline below 4.2 percent when they are currently at 4.34 to 4.38 percent. And third, earnings growth needs to beat estimates and stay above 15 percent year over year. If the Hormuz ceasefire holds and geopolitics ease, oil could fall 10 to 15 dollars by the third quarter of 2026. When that happens, the reallocation from global funds back into emerging markets will begin.
English
India saw 1.92 trillion rupees in FPI outflows during the first four months of 2026, which actually exceeds the entire year's outflow from 2025. Markets are calling this a crash in confidence, but if you actually dig into the data, you'll find a completely different story starting to unfold. Here's what's really happening beneath the headlines.
English