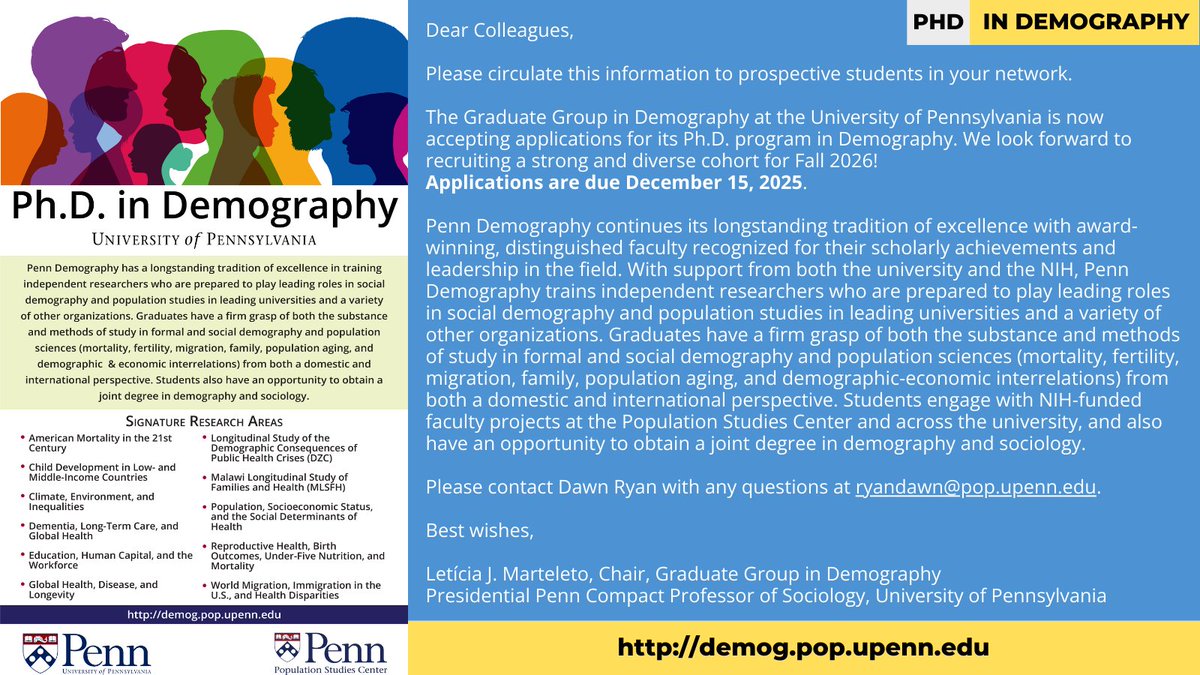
The Graduate Group in Demography at the University of Pennsylvania is now accepting applications for its PhD program in Demography. We look forward to recruiting a strong and diverse cohort for Fall 2026! Applications are due December 15, 2025. Learn More: demog.pop.upenn.edu/prospective-st…
Congratulations to @Ladys_gw on defending her thesis last Friday ! She will be joining @PennPSC for a postdoc.
Here, she is pictured with @willafriedman and Aimee Chin, (members of her 4 member committee also including @fanwangecon and Sharon Wolf (@penn) )
Understanding the difference between Standard Deviation (SD) and Standard Error (SE) is crucial for accurate data interpretation. SD measures the variability within your data, indicating how spread out the individual data points are from the mean.
In contrast, SE measures the uncertainty around the sample mean as an estimate of the population mean. It reflects the precision of the mean, with SE decreasing as the sample size increases, making your estimate more reliable.
The relationship between SD and SE is given by the formula: SE = SD / √(sample size). While SD remains relatively constant with larger samples, SE diminishes, highlighting the reduced uncertainty in the mean estimate.
A common mistake in research is using the “±” notation without specifying whether it refers to SD or SE, leading to potential misinterpretation of the data. Clear distinction is essential for transparency and accuracy in reporting.
Key Takeaways:
• Use SD to describe data variability.
• Use SE to indicate the precision of the mean.
• Always specify which measure you are reporting.
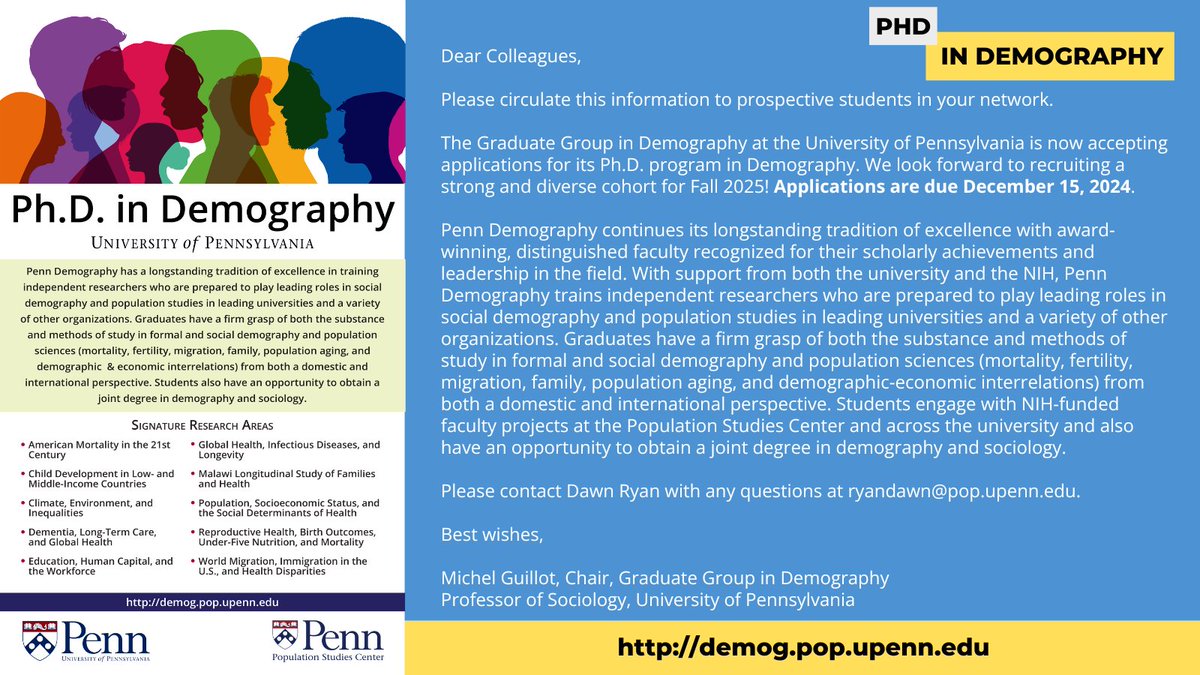
The Graduate Group in Demography at the University of Pennsylvania is now accepting applications for its PhD program in Demography. We look forward to recruiting a strong and diverse cohort for Fall 2025! Applications are due December 15, 2024. Learn More: demog.pop.upenn.edu/prospective-st…
The Developers Foundry Fellowship deadline extended to August 9th!
This is your chance to transition from entry-level talent to a mid-level professional through our intensive one-year fellowship.
Don’t miss out! Register now: developersfoundry.org
The single best thing a student intending to use data should do is the following:
Learn the difference between description, prediction, and causal inference.
"I want to predict..." -- I am willing to bet you don't.
@ST_Fedelis@code_micky This is a senseless comment and not needed. If he is NDC what is wrong, he has the right to join any political party of his choosing. Learn to accommodate the choices of others because at the end of the day, you are not feeding him.
2 out of 3 #Alzheimers patients are women.
Brain Health is Women's Health.
My new book, the XX Brain, represents a decade of research on what happens to the female brain, why, and what now. You can pre-order at bit.ly/xxbrain and review research background on my site^
I once believed crafting a PhD Literature Review was just about showcasing a sea of existing knowledge.
I couldn't have been more wrong.
A PhD Literature Review is:
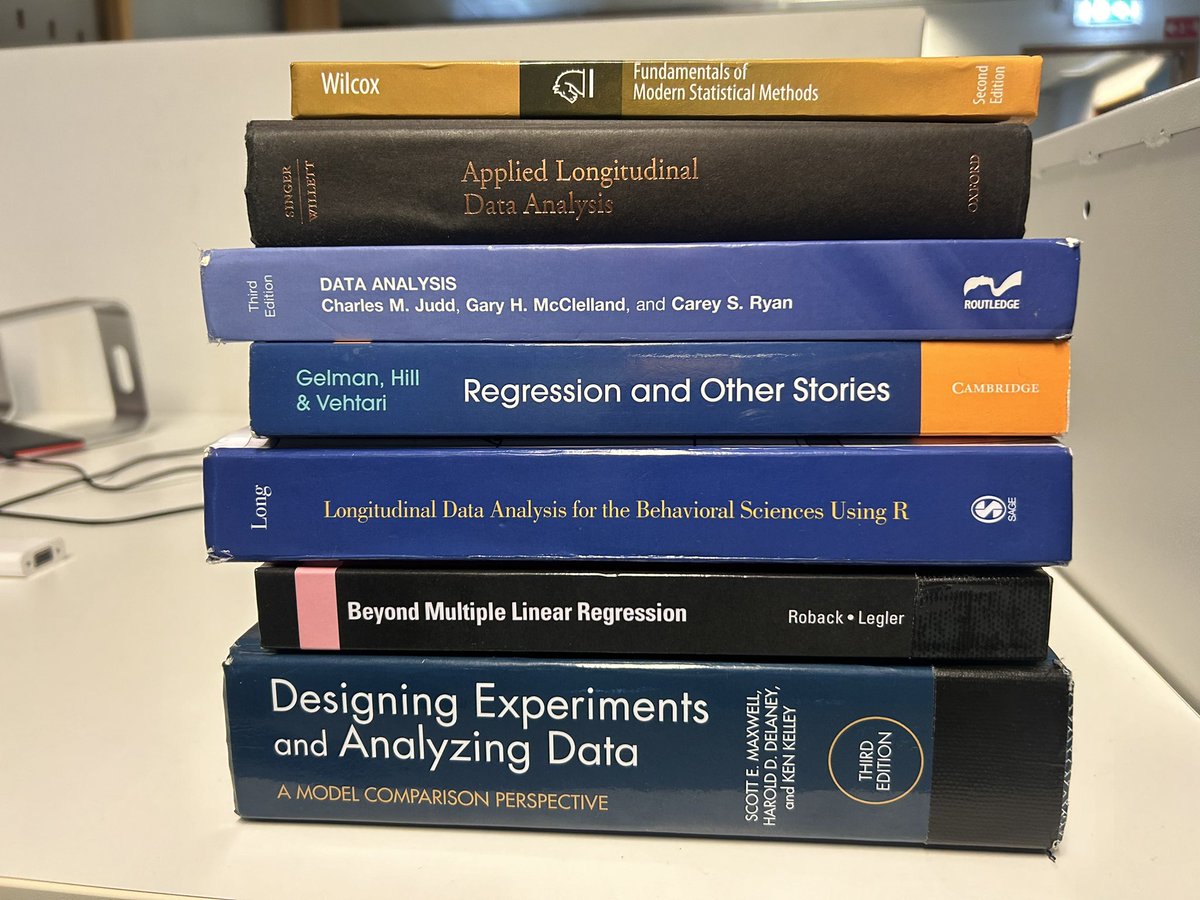
As my PhD comes to an end, I want to acknowledge the methods books that have been instrumental in my journey. *Missing from the list is statistical rethinking
This book by Dale Barr has also been exceptionally helpful:
psyteachr.github.io/stat-models-v1/
Just figured out how to allow for different x-axis labels when using facet_warp(). The trick has a few steps, which I've annotated in the code below.
#ggplot2#RStats
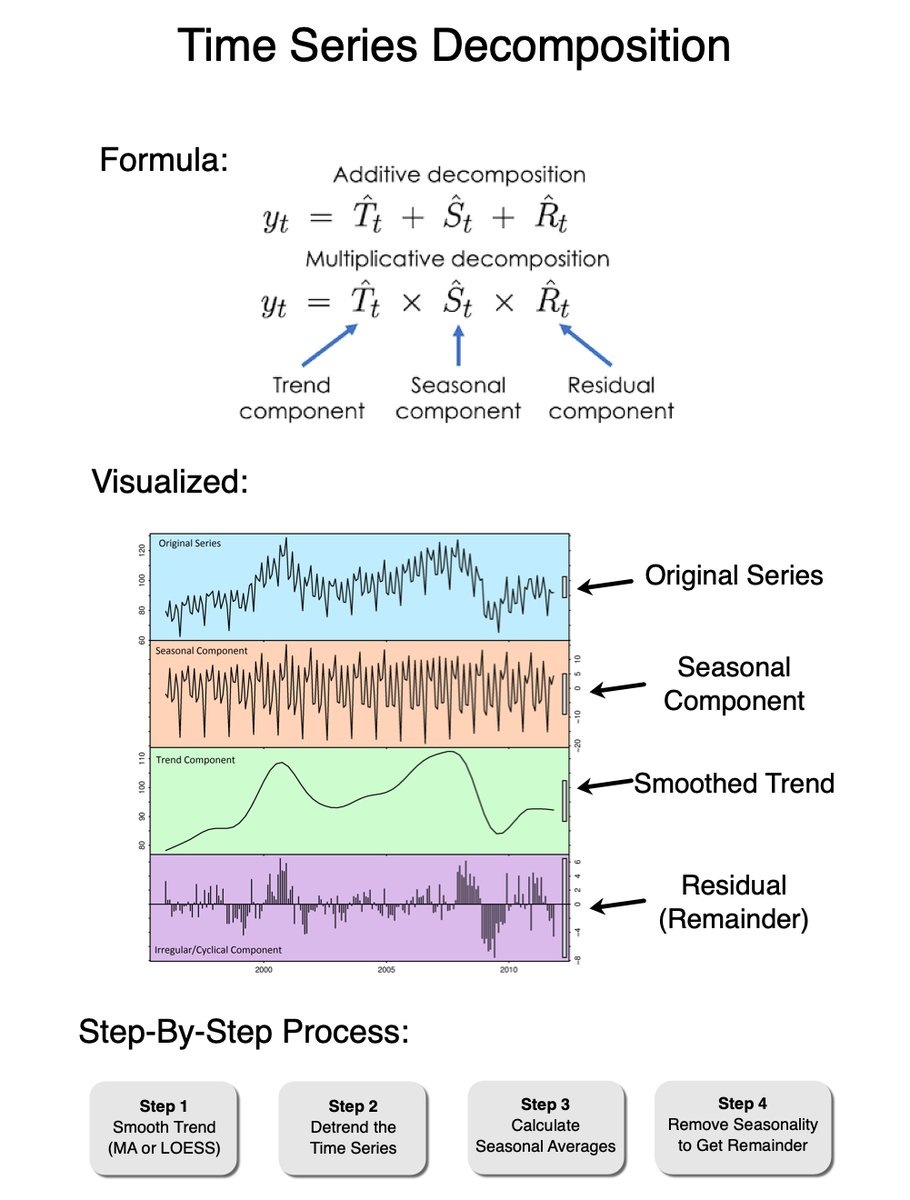
When learning Time Series, I struggled to understand Time Series Decomposition. In 3 minutes, I'll share 3 months of research on Time Series Decomposition (Business Case included). Let's go!
1. What is Time Series Decomposition? TS Decomp is a statistical method used to deconstruct a time series into several components, each representing underlying patterns in the data. There are 3 key components: Trend, Seasonal, and Residual. Let's break them down.
2. Trend (Step 1): Trend is the long-term movement of the series. Typically we use a smoother (LOESS, LOWESS) or moving average to calculate the trend. The key is that it removes the seasonal variation from the time series.
3. Detrended Time Series (Step 2): We remove the trend component from the time series. This has the effect of making the time series "stationary" (well sort of). Stationary just means the detrended series no longer goes up or down but is centered.
4. Seasonal (Step 3): The seasonal component captures regular patterns of variability within specific, fixed periods, such as daily, weekly, monthly, or quarterly fluctuations. The seasonal component is commonly calculated by using an average or median value at a seasonal frequency (e.g. daily, monthly, etc).
5. Residuals (Remainder) (Step 4): The irregular component, also known as the residual or noise, represents the random variation in the data that cannot be attributed to the trend, seasonal, or cyclical components. These are unforeseen variations that do not follow a predictable pattern.
6. Business Case:
In 2018, I was hired by a big marketing company as a consultant. Their customer (an even bigger Automobile Company) had a BIG problem. They couldn't tell which marketing campaigns (Events) were driving important goals (e.g. Test Drives and Vehicle Purchases).
Fortunately, they had 2 things: website traffic data AND campaign events (timestamps).
I used Time Series Decomposition to analyze their web traffic. What was critical was the "residual". This held the secrets to anomalies.
We could tie back the anomalies to user interactions on the web, signups for test drives, and vehicle sales.
The result was an 8% increase in vehicle test drives. Even a 10% conversion, made their client $100,000,000.
Shocking what a little time series can do for a company.
===
There’s a lot more to learning Time Series for Business.
I’d like to help.
I put together a free on-demand workshop that covers the 10 skills that helped me make the transition to Data Scientist: learn.business-science.io/free-rtrack-ma…
And if you'd like to speed it up, I have a live workshop where I'll share how to use ChatGPT for Data Science: learn.business-science.io/registration-c…
And if you'd like to learn Time Series at a deeper level, I have a course: university.business-science.io/p/ds4b-203-r-h…
If you like this post, please reshare ♻️ it so others can get value.