Our latest project is live. => "Children born today may never experience the world as you’ve known it. How does the temperature over your lifetime compare to other generations? Discover your personal climate stripes." newsinteractives.cbc.ca/features/2023/…@jbernstien@CBCNews
It’s been a wonderful 10th birthday month. 🎂
In this recorded interview, Chris Parmer, #Plotly Co-Founder, Chief Product Officer, and creator of Dash reflects, “it was just so clear that this was a better way of working with data and graphs— by doing it in the web browser.” youtube.com/watch?v=OqVxK7…
Thank you for your continued support over these past 10 years! ❤️
These Montreal neighbourhoods are where you're most likely to get your bike stolen
Good data-driven report, with an informative table and honest caveats about the limitations of the data, by @hleahcabreracbc.ca/news/canada/mo…
Why is housing so much cheaper in Quebec than Ontario? A historical look at the unintended consequences of a tax meant to finance city services, but that got passed on to owners and renters.
policyoptions.irpp.org/magazines/augu…
10 #Python million downloads for our 🔟 year anniversary! pypistats.org/packages/plotly#Plotly was founded in August 2013. Since then, with help from our customers, investors, and the incredible #Dash community over the years, we’ve accomplished:
⚙️ Helping data science teams build interactive data apps
📊 Enabling truly data-driven decision making
🚀 Building connections and learning along the way
To celebrate, we will be sharing some special birthday surprises this month. Stay tuned! 🎂
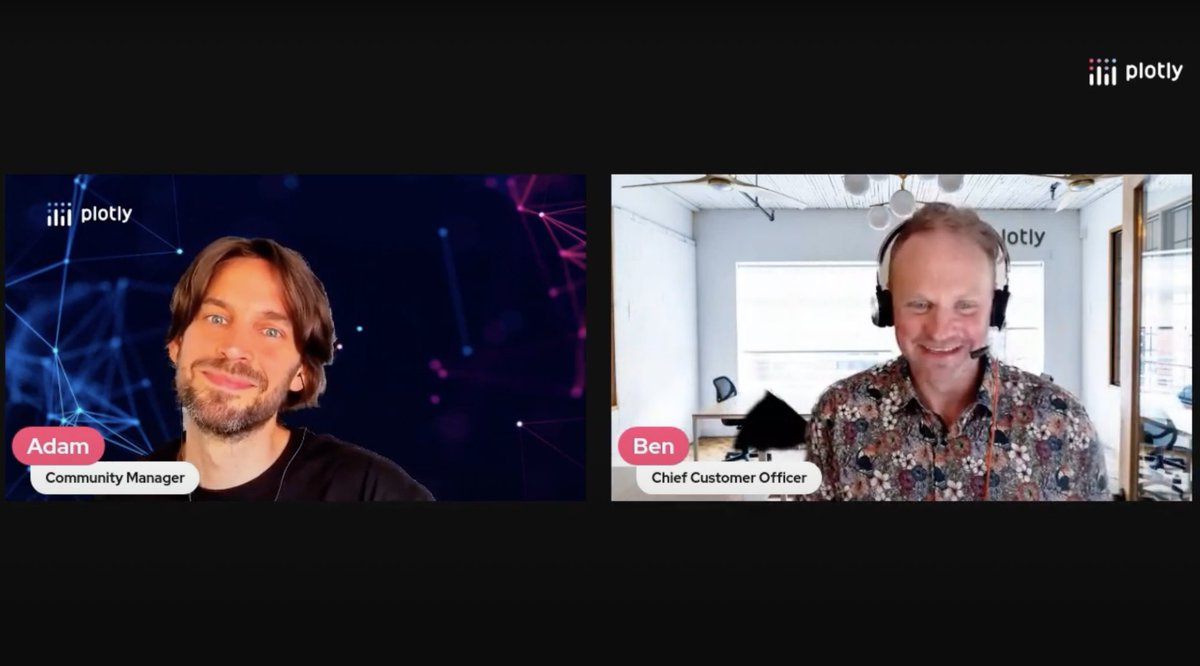
“I love working with people and seeing what we can do better. I love that as much as writing code – or even more.”
Meet #Plotly’s first employee, Ben Postlethwaite. Ben walked into our Montreal coworking space 10 years ago as an individual contributor. Now, he's the Chief Customer Officer, responsible for managing our Professional Services, Technical Account Management, and Customer Success teams. 👏
Watch his interview with @CharmingData to learn how Ben and his teams support #Dash Enterprise customers with their data and AI goals. 🚀 youtube.com/watch?v=KT_z3R…
Free on the 31st? Wanna know how we do data-driven investigations in @IJFMedia ? I'll be showing how we found the lobbyists that attended Liberal fundraisers since 2018 with @PyDataMTL . Come geek out:
meetup.com/pydata-mtl/eve…
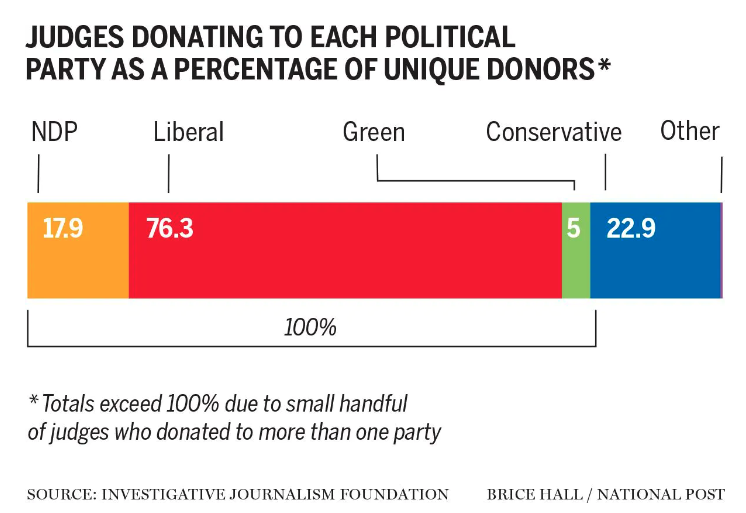
Une enquête du @nationalpost et @IJFMedia sur 1308 nominations judiciaires par le gouvernement libéral depuis 2016 révèle que 76,3% des personnes nommées - ayant précédemment effectué des dons politiques - avaient donné au PLC. #polcantheijf.org/trudeaus-law-s…
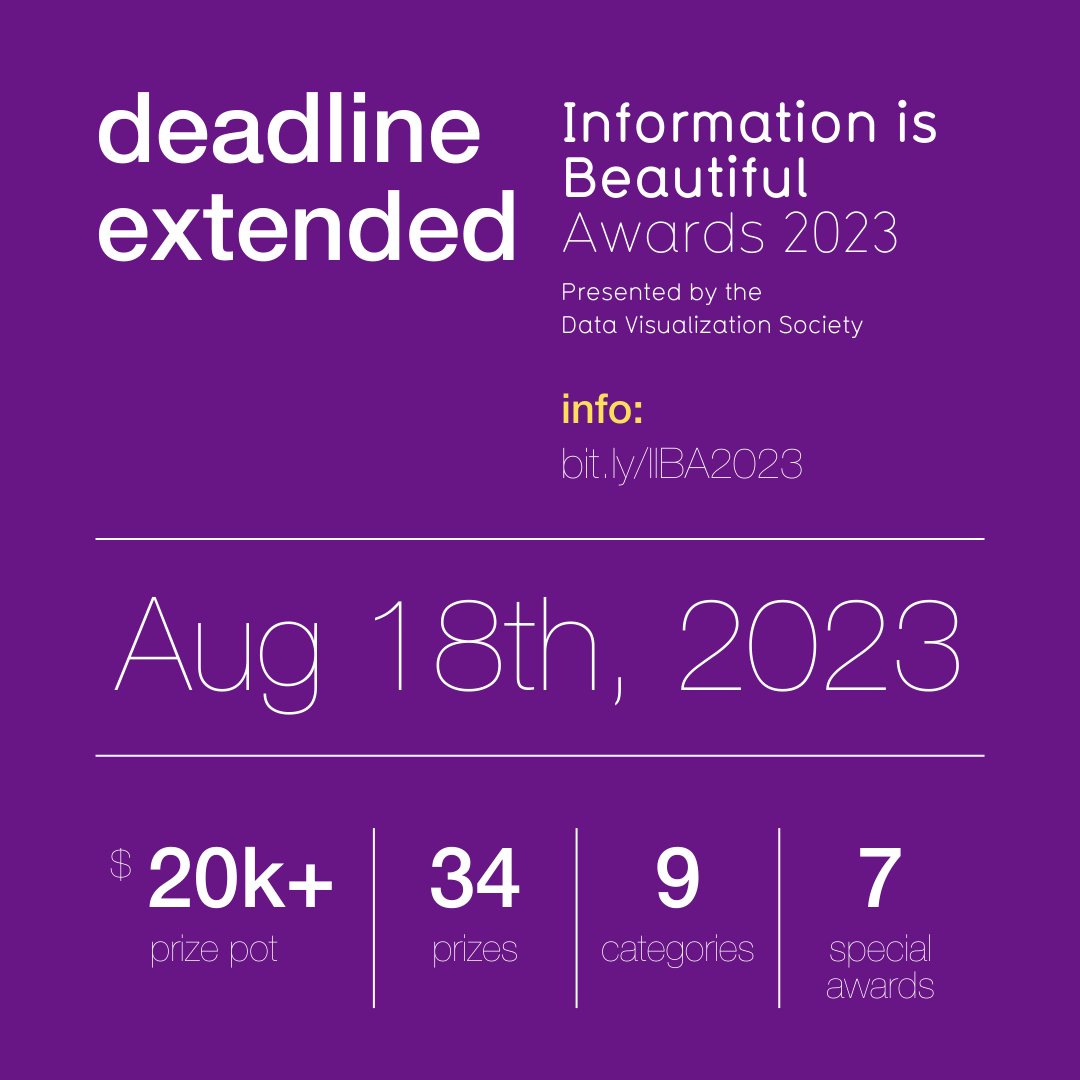
The DVS Mentorship Program is a great way to make connections and pick up #dataviz skills & resources to advance your career. If you are considering the program, don't miss this piece from @TF_Johnston about her experience as a mentee!
nightingaledvs.com/dvs-mentorship…
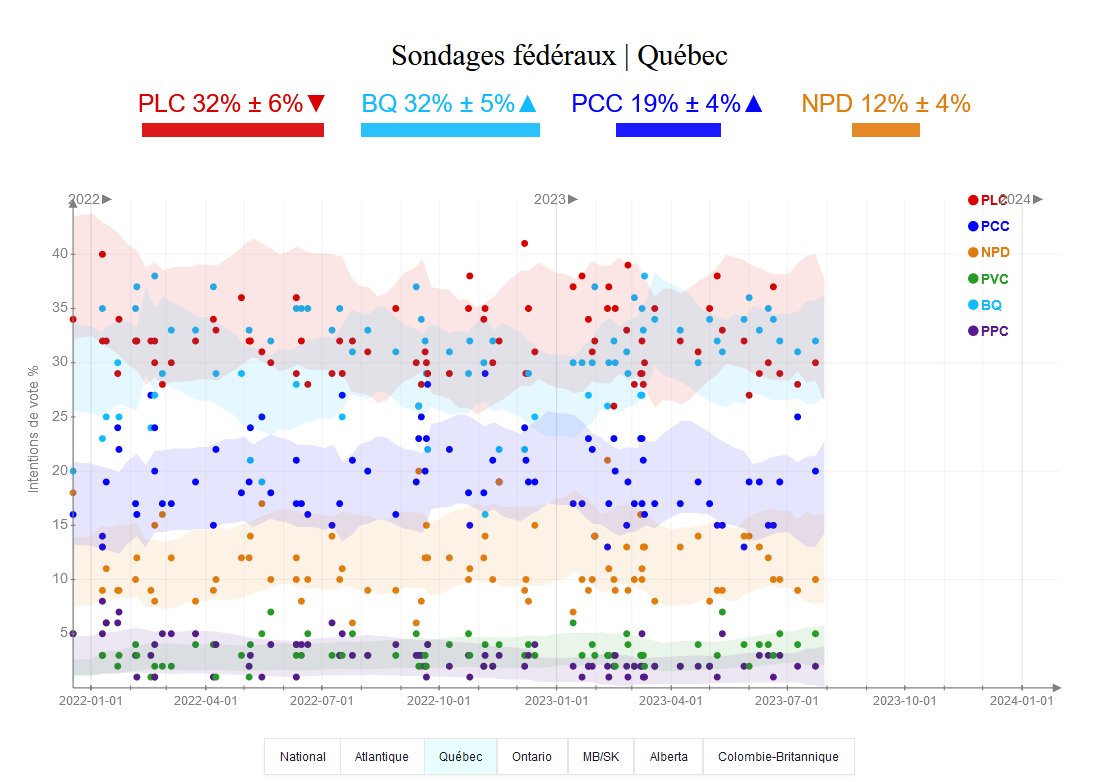
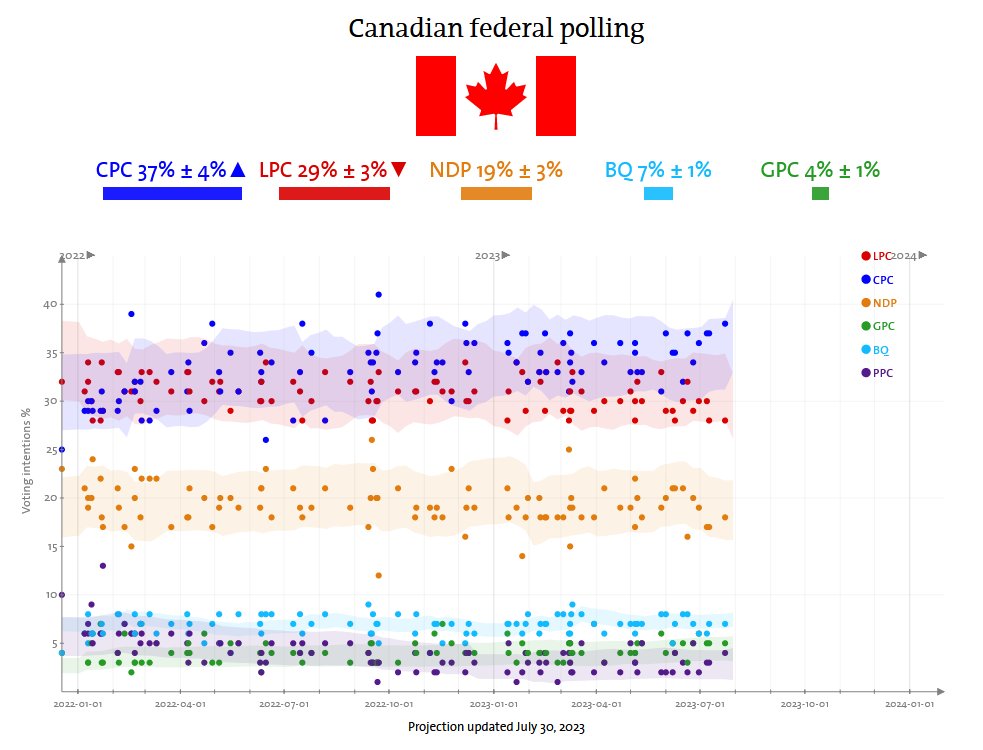
Égalité statistique au Québec entre le PLC et le Bloc québécois.
Le PCC est-il en hausse au Québec? Trop tôt pour le dire, mais les deux sondages de la semaine passée le mesuraient à 20% et 25% au Québec.
qc125.com/canada/sondage…
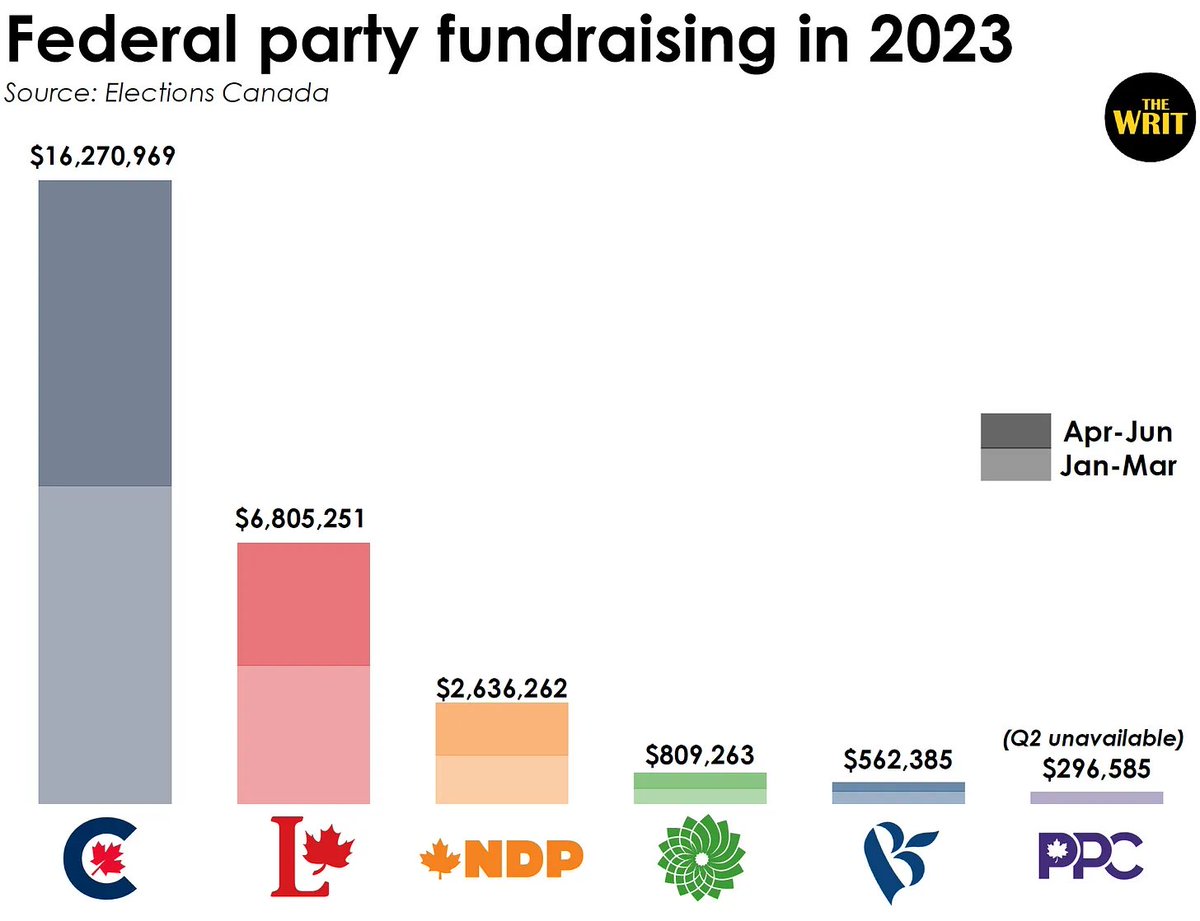
The Conservatives continue to out-fundraise the Liberals, opening their widest gap ever. This and much more in the Weekly Writ: thewrit.ca/p/the-weekly-w…#cdnpoli
The Dear Nightingale challenge is on! This summer, we invite you to unravel, cut, and pull apart #textiles to create a meaningful #dataviz from the threads and fabric. Hosted by textile artist India Johnson. Submit by August 4!
nightingaledvs.com/dear-nightinga…