v|v analytics
73 posts

v|v analytics
@viv_analytics
Enhance decision-making using Data (and) Science
Zurich, Switzerland Katılım Ocak 2022
374 Takip Edilen42 Takipçiler

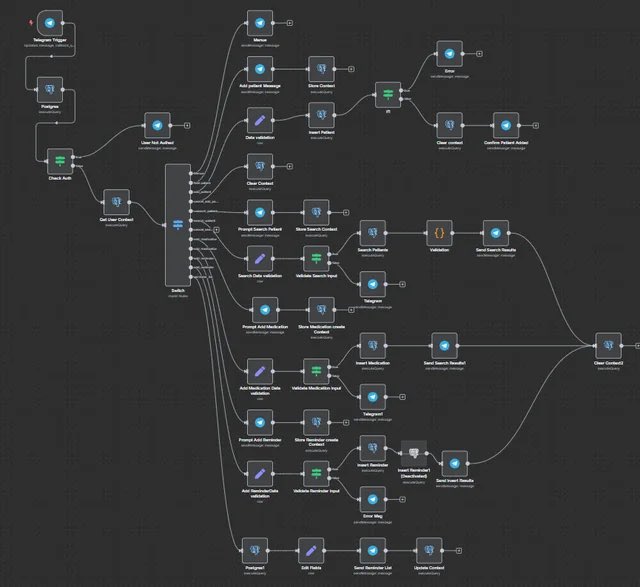
99% of the AI agent tutorials on YouTube are garbage.
I’ve built 47 agents with n8n and Claude.
Here are the 3 prompts that actually work (and make agent-building simple).
Bookmark this post
🔖
Bonus: comment "Agent: and I’ll DM you AI agent system prompt + full guide ↓
English

Most people use Claude Code like a chatbot.
So I documented the most complete setup you can install today.
Inside:
→ How to run 10 to 15 Claude sessions at the same time across terminal and browser
→ The CLAUDE. md file that writes its own rules after every correction so the same mistake never happens twice
→ Plan Mode workflow so Claude builds a full plan before touching a single file (with the exact activation steps and what to say)
→ How to actually use slash commands for every task you repeat more than once a day
→ Subagent setup so Claude reviews, simplifies, and verifies its own work without you managing it
→ The verification loop that produces 2 to 3 times better output on every task
→ Safe permissions setup so Claude never needs unrestricted access to your machine
→ MCP connections for Slack, BigQuery, and Sentry so Claude uses your tools directly
→ PostToolUse hooks so code formatting never causes errors in review
→ Ready to use files including CLAUDE. md, subagents, slash commands, and hooks
→ Common mistakes that slow Claude Code down and the exact fixes Boris uses
If you build with AI daily, ship code, or manage a team using Claude Code - this is the only setup guide you will need.
Comment "CLAUDE" and I will send it straight to your DMs.

English

you're prompting claude code wrong
using it like glorified chatgpt with terminal access
this way, you’re missing the entire power system
claude code has custom prompt configurations
hidden in plain sight
here's how to do it correctly:
drop instructions in specific files
claude reads them before every response
transforms from assistant to autonomous builder
if every session you're:
→ getting lazy, incomplete outputs
→ debugging hallucinated code
→ watching claude work sequentially (very slow)
→ re-explaining project context
→ accepting "tests pass" instead of real solutions
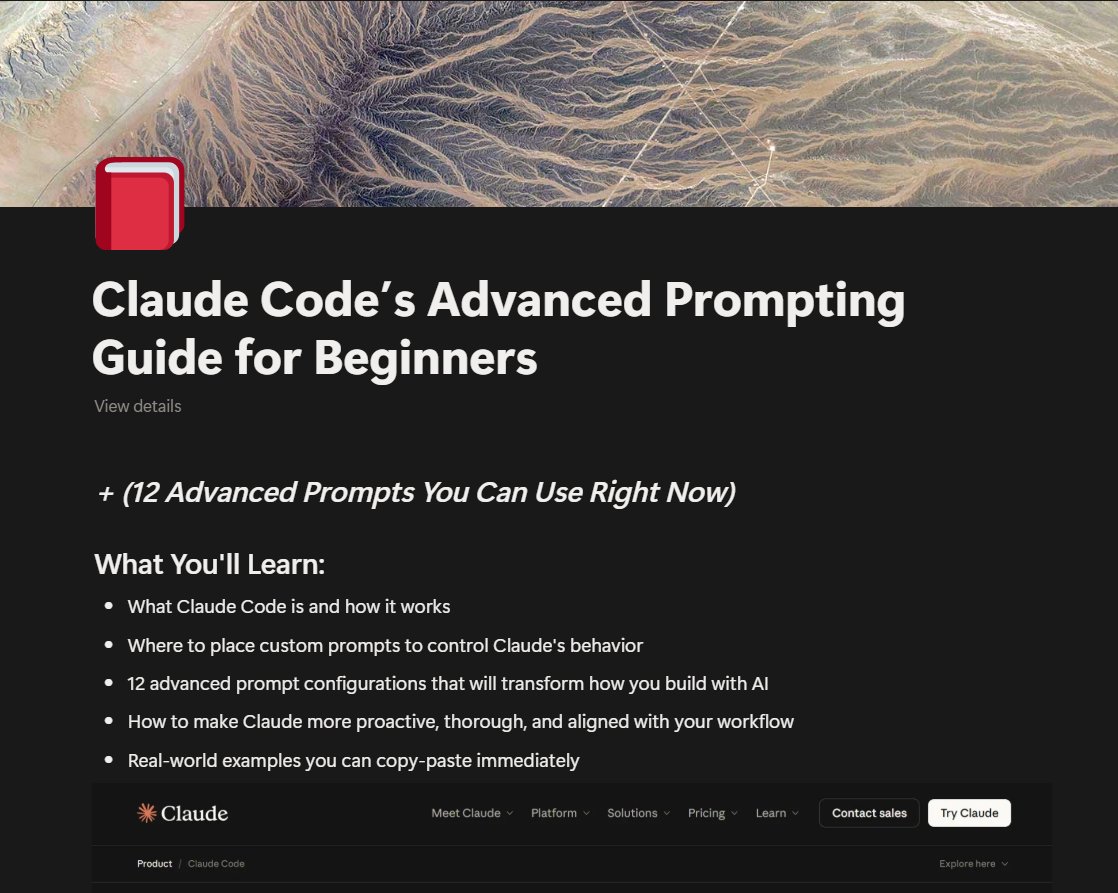
i’ve compiled 12 advanced prompts:
- hyper-proactive mode (no lazy outputs)
- conservative mode (fewer risks)
- parallel execution (3x speed boost)
- reduce hallucinations (critical)
+8 more to fix these inconsistencies
comment “prompt engineering” to get the FULL claude code’s prompting guide FREE
(must follow to receive dm)
English

Fuck it.
I’m dropping my full Deep Researcher Mega Prompt for free.
It turns ChatGPT, Claude, and Perplexity into a real research analyst:
→ Structured insights
→ Market breakdowns
→ Competitor analysis
→ Multi-layer reasoning
Comment “Research” and I’ll DM you the file.
(Must be following me to receive it)

English

@selcukorkmaz I would like to explore the possibility of using a specific metric_set(). Could we discuss how this might be implemented?
English

fastml Tutorial: From Simple to Advanced
This tutorial demonstrates how to use fastml through a series of progressively complex examples. Each example introduces new arguments and techniques.
#Rstats #DataScience #MachineLearning
github.com/selcukorkmaz/f…
English
@CausalHuber @mitpress Thank you so much for sharing! I'm really looking forward to diving into it.
English

Just 1.5 months to go until my book Impact Evaluation in Firms and Organizations is out with @mitpress! An accessible introduction to impact evaluation & causal machine learning, with examples in #R & #Python: mitpress.mit.edu/9780262552929/…
Examples (for free): dataverse.harvard.edu/dataset.xhtml?…


English


Presenting your statistical models in a clear and professional manner is as crucial as the analysis itself. Here's a simple method to make this process very easy!
LaTeX, a high-quality typesetting system, is often the go-to for academic and scientific documentation due to its ability to handle complex tables and mathematical expressions with elegance. When it comes to sharing the results of a regression model, seamlessly integrating these results into a LaTeX document can elevate your work's clarity and impact.
This is where R and the xtable package come into play, providing a straightforward pathway to bridge your analysis with LaTeX's typesetting capabilities. Here’s how:
# Load xtable
library(xtable)
# Load example data
data(mtcars)
# Linear regression
my_mod <- lm(mpg ~ wt + qsec, mtcars)
# Summary statistics
summary(my_mod)
# Create LaTeX table
print(xtable(summary(my_mod)), type = "latex")
This code snippet accomplishes a few key tasks:
📊 Data Analysis: Utilizes the mtcars data set to perform a linear regression, examining how the variables wt (weight) and qsec (quarter-mile time) predict mpg (miles per gallon).
🔍 Statistical Summary: Provides a comprehensive summary of the regression model, offering insights into the relationships between variables.
📝 LaTeX Integration: Converts the model summary into a LaTeX-friendly table using xtable, making it ready for inclusion in any document or publication. This step is crucial for researchers and analysts who need to present their findings in a standardized and visually appealing format.
By leveraging xtable with R's analytical power, you can efficiently prepare your regression analysis results for high-quality documentation, enhancing readability and professionalism in your presentations or publications.
Interested in deepening your understanding of topics like this? Subscribe to my free newsletter for regular insights on statistics, data science, and programming.
See this link for additional information: eepurl.com/gH6myT
#Data #statisticsclass #database #coding

English
@frankiethull Wow, this is truly awesome.
I’d love to test this but I‘m facing an issue with {maize} since it expects R >= 4.4.1 but we currently use 4.4.0 🫣
English

@viv_analytics Thanks for helping me document {maize} 🌽! I wrote a quarto vignette showcasing {probably}, which led me to testing {tailor} for the first time. It's new and in development, but the workflow support will be a game changer. {tailor} tests are also in the vignette 🙌🏻
English
TIL about `initial_validation_split` in the {rsample} package for R 😯
The more I use {probably} for model calibration and prediction intervals, often need a third holdout set.
This three-way split method is really helpful for these post modeling processes!
English
@simonpcouch I’m really excited to dive into learning more soon!
English

Some news: I've just open-sourced the draft of a book I'm working on about how #rstats tidymodels users can make their code run faster without sacrificing predictive performance!
simonpcouch.com/blog/2024-10-2…
GIF
English

A single dose of psilocybin changes the brain.
🧵1/12

English
@RandVegan I tried using beta coefficients from a multivariate regression, and then I calculated the marginal contribution of each asset to the portfolio's correlation with the variable of interest.
Normalize the weighted Beta coefficients so that they sum up to 100%.
English

@viv_analytics to keep it simple we assume equal weights
I don't think you can do this but I want to see if there is a way to express a portfolio's overall correlation by the sum (or other aggregated statistic) of its part's correlation
eg asset 1 contributes 40% of portfolio's correlation
English
stats gurus -- if I have a portfolio with an overall correlation to some variable, can I show each asset's correlation as a % of that overall portfolio correlation?
English
@R_Graph_Gallery @JoachimSchork I find {ggdist} very useful to visualize distributions, e.g stat_halfeye()
mjskay.github.io/ggdist/index.h…
English

R offers _thousands_ of packages. 🙈
I curated a list of the 47 best packages for #dataviz
r-graph-gallery.com/best-dataviz-p…
For each package:
🔎 In-depth description
⚡️ Main features with code
📖 Real-life examples from the gallery
➡️ Agree with my list? Which one is missing? 🤔
English
@JoachimSchork Are you going to cover the usage of packages from @easystats4u in the course?
English
I'm in the final stages of preparing for the upcoming online course on Statistical Methods in R, which starts next Monday, September 9.
The content is nearly complete, and we have a comprehensive list of methods and concepts to cover. To give you a glimpse of what the course entails, here are 10 key methods that will be taught:
- ANOVA (Analysis of Variance): Tests if the means of three or more groups are significantly different.
- Binary Logistic Regression: Predicts the probability of a binary outcome based on predictor variables.
- Bootstrap Resampling: Estimates statistics by repeatedly sampling with replacement from the data.
- Chi-Squared Test for Independence: Tests if there is an association between two categorical variables.
- Confidence Intervals: Provide a range that likely contains the true population parameter, given a certain confidence level.
- Correlation Analysis: Measures the strength and direction of a linear relationship between two variables.
- Multiple Linear Regression: Models the relationship between a target variable and multiple predictor variables.
- Random Forests: An ensemble of decision trees used for classification and regression.
- Ridge Regression: A type of regression that adds a penalty to the size of coefficients to reduce overfitting.
- T-Test (Two-Sample): Tests if the means of two independent groups are significantly different.
Please note that this is just a selection of the methods we will cover; the course will discuss many more topics.
Are you interested in learning more about these topics? Check out the upcoming course: statisticsglobe.com/online-course-…
#rstats #statistics #statisticalmethods #datascience #dataviz

English