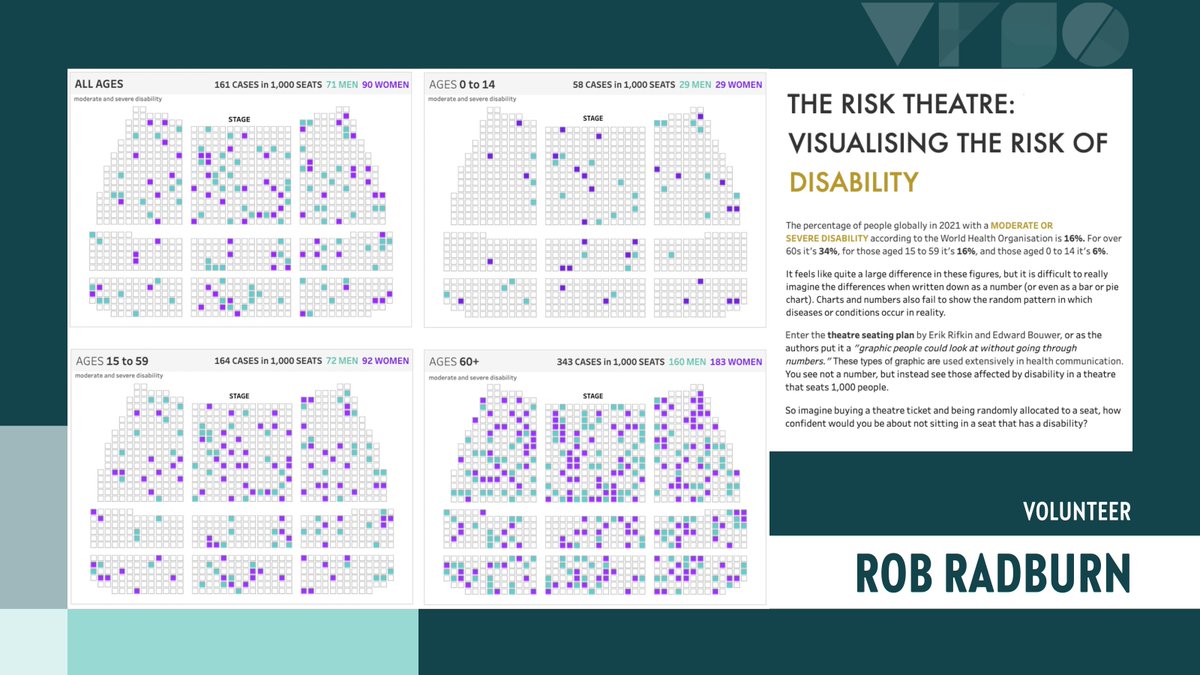
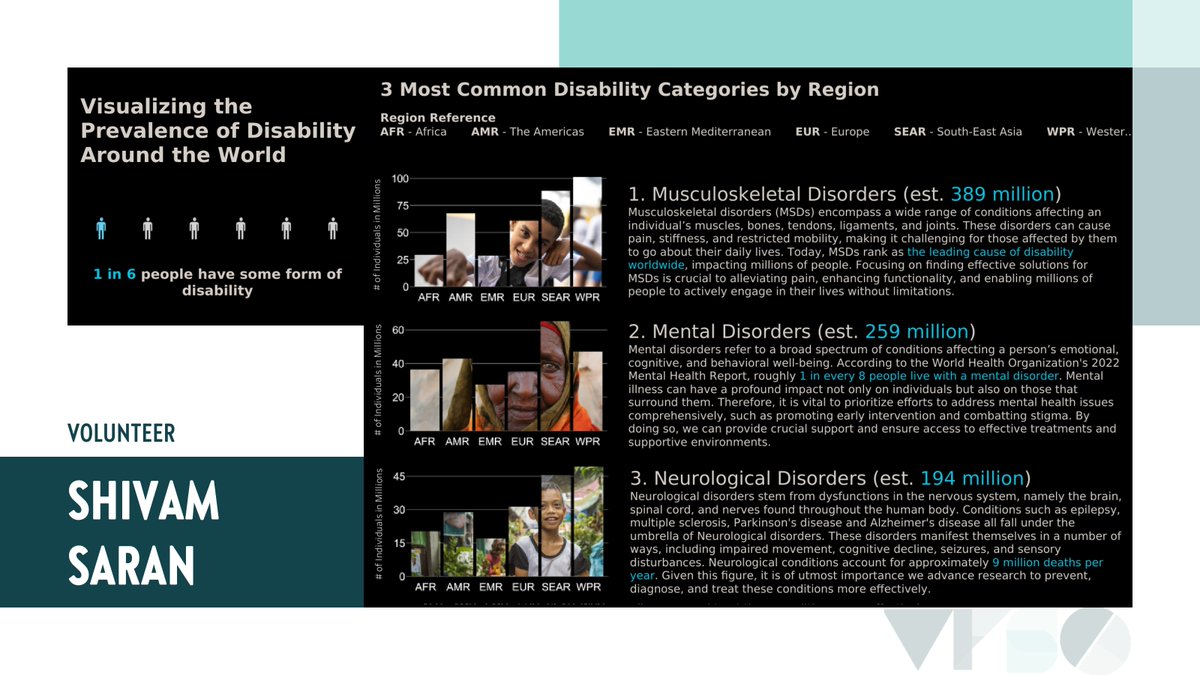
Flore

48 posts

Flore banner
Flore

Flore

@wildvariables

out of twitter

Brésil Katılım Haziran 2022
246 Takip Edilen109 Takipçiler
Flore
Flore@wildvariables·
I've been working on a new interactive data visualisation for the past week. Hopefully, I'll be able to release it tomorrow 👀 #TDF2024
Flore tweet media
English
0
0
2
153
Flore
Flore@wildvariables·
I hope these resources helped you raise some reflections about how we usually represent our world! Do you have other ideas of projection to test out?
English
0
0
0
52
Flore
Flore@wildvariables·
#30DayChartChallenge | Day 25 - Global Change For this prompt, I'm asking you to make a global change... of perspective and projection. Several works (mentioned below) inspired this very simple map, challenging the usual world map projections🌎 Made with Flourish and Figma
Flore tweet media
English
1
0
12
460
Flore
Flore@wildvariables·
#30DayChartChallenge | Day 24 - ILO Region for Africa I ran out of time and didn't manage to find a dataset from ILO. Instead I tried to highlight one of the things some countries of Africa and South America (including Brazil) have in common 🍫 Made with Flourish & Figma
Flore tweet media
English
1
0
14
768
Flore
Flore@wildvariables·
#30DayChartChallenge | Day 23 - Tiles Second viz of the day, turning tiles into turtles 🐢 Made with Figma
Flore tweet media
English
3
1
43
1.9K
Flore
Flore@wildvariables·
#30DayChartChallenge | Day 22 - Mobility Cycle paths and cycle lanes in the ten most populated brazilian cities 🚲 Made with Svelte and D3js
Flore tweet media
English
0
0
13
539
Flore
Flore@wildvariables·
#30DayChartChallenge | Day 21 - Green energy Top 5 Countries in Renewable Energy Consumption (2022) Made with RawGraphs and Figma
Flore tweet media
English
0
2
15
586
Flore
Flore@wildvariables·
#30DayChartChallenge | Day 20 - Correlation Few years ago, I created the first version of this visualization related to the deforestation of Brazil's #Amazon. I never published it so it seems a good time to update it🌿 Made with Flourish and Figma
Flore tweet media
English
1
4
50
2K
Flore
Flore@wildvariables·
#30DayChartChallenge | Day 19 - Dinosaurs After few days of break, it's time to continue the challenge! Here, I wanted to highlight a recent discovery made at @UnipampaOficial Made with Illustrator and Figma
Flore tweet media
English
0
1
14
516
Flore
Flore@wildvariables·
#30DayChartChallenge | Day 18 - Asian Development Bank I struggled to link the prompt to my brazilian theme but I found some old data about developing Asian and Latin American countries (data.adb.org/dataset/years-…) and tried to make an updated version Made with Flourish and Figma
Flore tweet media
English
0
0
9
656
Flore
Flore@wildvariables·
#30DayChartChallenge | Day 17 - Networks For yesterday's prompt, I worked on my first R project. I only had time to reproduce the map from one of @milos_agathon's amazing tutorials and play with colors Made with R
Flore tweet media
English
2
9
42
6.7K
Flore
Flore@wildvariables·
#30DayChartChallenge | Day 15 - Historial We're halfway through the challenge, and I'm proud to have made it through the first 15 days! The viz of the day is celebrating the amazing athlete #Marta, and her historic record with the national team Made with #Svelte and #D3js
Flore tweet media
English
1
3
22
912
Flore
Flore@wildvariables·
#30DayChartChallenge | Day 14 - Heatmap Heatmap on heat: how the maximum temperatures evolve through the year in the ten most populated Brazilian cities Made with #Svelte and #D3js
Flore tweet media
English
1
2
38
2.6K