Sabitlenmiş Tweet

Part 1 refresher: I occasionally read through social media, and I come across two different classes of faux dealer positioning services:
1. Services that are technical in nature about dealer positioning dynamics around delta, gamma, and other movement-based greeks; and
2. Services for “traditional” volatility traders, who see the world through a volatility lens and measure their trades against dynamics in the vol curve.
These two classes of traders ignore each other at best, and scoff at each other at worst.
Last week, in part 1 (x.com/WizOfOps/statu…) , I wrote about the first faux dealer positioning class: those services that use open/close data to make trading decisions. I exposed the top-level issues of why these services miss the mark.
I also dismissed the reductive #GEX and midpoint services, as their data are products of quickie formulas that are fraught with terrible assumptions that are not even remotely true. Not all puts are bought, and not all calls are sold. It was a good assumption when SqueezeMetrics wrote his white paper many years ago, but there is more data availability now. Analyzing based on the midpoint of a bid/ask spread implies perfect market balance, which is also rarely true. Especially on illiquid issuances, you will find bid-ask prices fade strongly away from their fair value, making midpoints a poor read of fair value.
The Volatility Services
The second category of dealer positioning services is the volatility services. These services use changes in implied volatility to assume changes in dealer positioning. It is a fair assumption, since dealers can reprice their options based on how they want to incentivize option flows. This category includes Dealer Directional Open Interest (DDOI) proposed by SqueezeMetrics in his paper “Implied Order Flows” and the skew/vol dynamics that are pervasive among academic literature.
The way the vol surface works is:
1. It is initially built using realized volatility methodologies like the Generalized Autoregressive Conditional Heteroskedasticity (GARCH) or Stochastic Alpha, Beta, Rho (SABR).
2. It then adjusts slightly as positioning comes in.
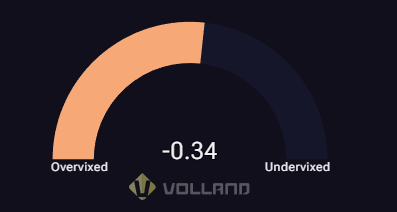
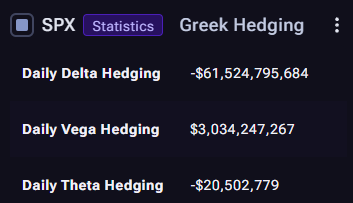
2a. If the net dealer position of aggregate vega is strongly negative, IV and skew will trend down.
2b. If the net dealer position of aggregate vega is positive, skew and IV increase.
These are the assumptions surrounding both #DDOI and vol dynamics, and they are generally accurate and observable. You can track fixed-price volatility across the curve and observe its movement.
However, those dynamics shows the present state of things. What the vol trader is missing is the trade-level dealer imbalance to anticipate how skew and IV will change based on movement in any of the variables involved with options, including movement of the underlying, IV, time, or interest rates.
Many vol traders intuitively recognize warning signs of mispricing based on realized volatility or historical implied volatility planes, but that is an incomplete picture. Every disclaimer says “Past performance does not imply future results”, but for some reason that is what market making pricing relies on.
DDOI attempts to assign these dynamics to individual trades. It is a bold attempt, but it doesn’t quite work due to the smoothing of the vol curve in liquid products. For instance, $SPY is one of the most liquid underlying options out there. If someone buys 1000 puts at 685, and someone else sells 200 puts at 684 at the same time, the whole vol curve will shift and the 200 puts would be classified as a “buy” in the DDOI system. You cannot rely on knots in the vol surface to happen due to the smoothing that market makers employ. It is a good attempt, but it runs into assumption problems.
Volland Sees The Complete Picture 🖼️
The volatility traders explained above don’t pay attention to #dealerpositioning, and the dealer positioning traders don’t pay attention to the volatility traders. They need to pay attention to each other to generate true alpha.
Here at Volland, we synergize both of these concepts and add in data analysis and novel uses of available datasets to get an accurate trade level view of the dealer book. Along with deep research into dealer methodologies and data analysis, we develop forecasts of dealer hedging flows.
Volland (vol.land) is where all of these concepts come together to show unmatched market edge.
English