WillP

98 posts

WillP banner
WillP

WillP

@wwil83

liverpool Katılım Mart 2013
96 Takip Edilen97 Takipçiler
WillP
WillP@wwil83·
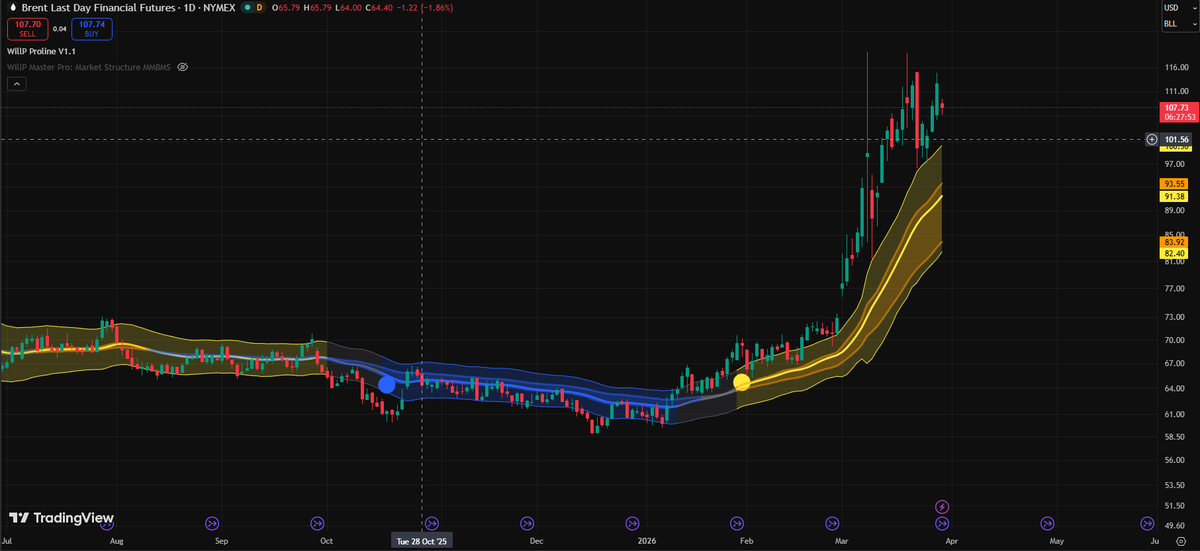
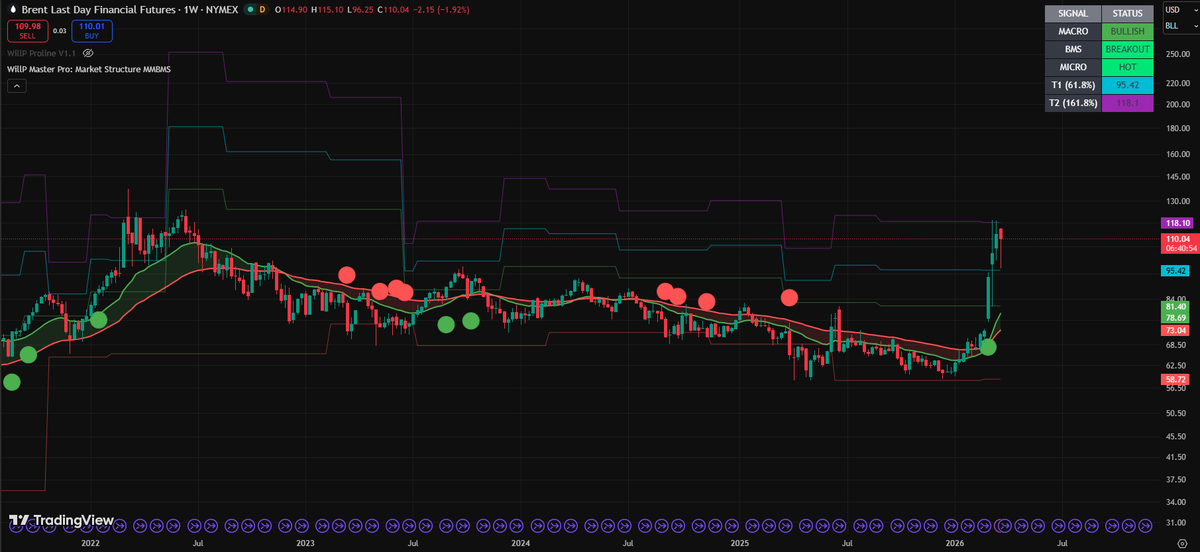
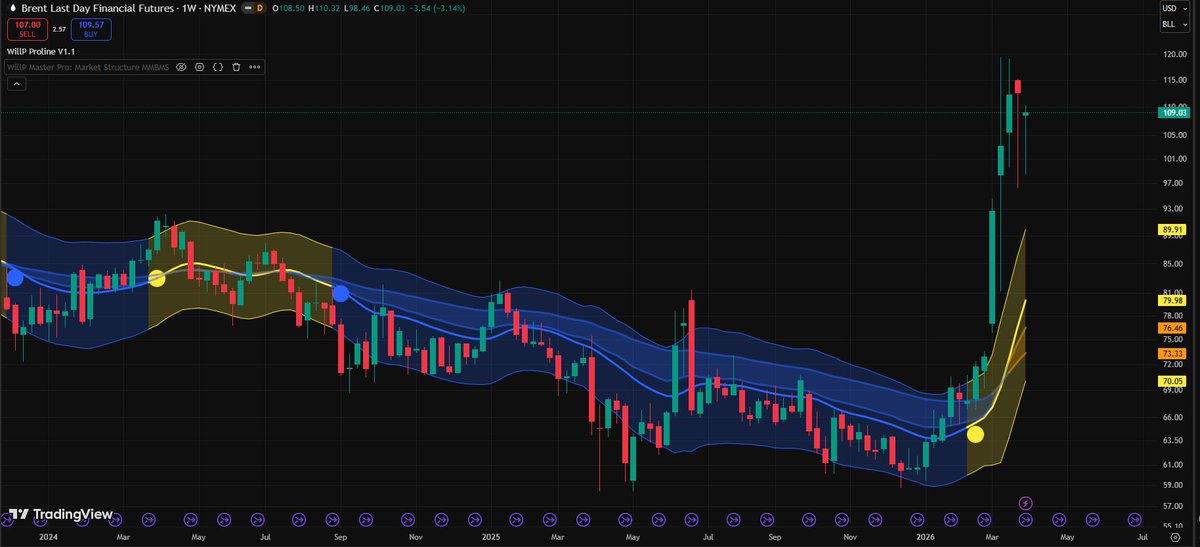
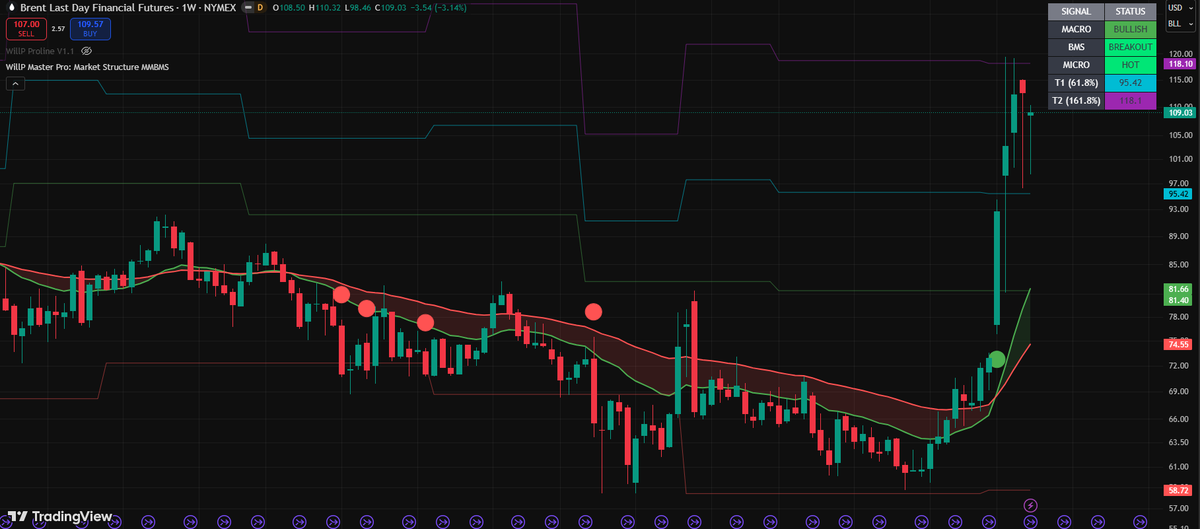
BZ=F (TRENT) bullish trend continues, with the ACL and MACRO signal confirming a bullish outlook. The RSI of 80.5 asset is overbought, but the BMS breakout signal indicates potential for further upside. Given the hot MICRO signal, nears term price target range could be $110-$115
WillP tweet mediaWillP tweet mediaWillP tweet media
English
0
0
0
16
WillP
WillP@wwil83·
BTC is Bearish, ACL and macro signals indicating downside pressure. An RSI of 33.3 oversold conditions, which could trigger a short-term bounce, but micro signals and BMS point to continued weakness. Near term, BTC may range between $60K and $70K, though this remains uncertain.
WillP tweet mediaWillP tweet mediaWillP tweet media
English
0
0
0
25
WillP
WillP@wwil83·
FET's current price is $0.2438 with a 5.91% increase in 24 hours. The BMS signal indicates a ranging market, suggesting a potential trading range. A reasonable price target range for FET could be between $0.22 and $0.28, considering the current RSI and sentiment.
WillP tweet mediaWillP tweet mediaWillP tweet media
English
0
0
0
11
WillP
WillP@wwil83·
Daily Chart, BZ=F (Brent) dropped ~3.9% in 24h despite a broader bullish trend. Momentum signals hint at a possible rebound, but RSI ~79 shows overbought conditions. Upside target: $110–115; downside support: $105–100.
WillP tweet mediaWillP tweet mediaWillP tweet media
English
0
0
0
32
WillP
WillP@wwil83·
SOL daily chart, is showing a bearish trend, as indicated by the ACL: BEAR signal. The RSI of 33.6 looking oversold, potentially lead to a bounce. However, with the MACRO & BMS signals being bearish, downside momentum may prevail. SOL at $84.35 and a further decline is possible.
WillP tweet mediaWillP tweet media
English
0
0
0
18
WillP
WillP@wwil83·
The summary indicates a neutral ACL for SUI, with a bearish macro outlook and ranging BMS (Buy or Sell signal). The RSI is at 29.7, suggesting the asset is oversold. Overall, the signals suggest a cautious approach, with no clear direction for the asset's price.
WillP tweet mediaWillP tweet mediaWillP tweet media
English
0
0
0
18
WillP
WillP@wwil83·
Total Crypto Market CAP bearish on the weekly as shown by the ACL indicator, when the yellow dot prints this will indicate a regime change. Macro bearish, BMS ranging, Micro cold.
WillP tweet mediaWillP tweet media
English
1
0
0
44
WillP
WillP@wwil83·
Based on the current signals, BTC is in a bearish trend with a neutral sentiment. The RSI of 32.4 indicates that the asset is oversold, which could lead to a potential bounce. Macro is bearish. Potential support or resistance is between $60K and $70K.
WillP tweet mediaWillP tweet mediaWillP tweet media
English
0
0
0
38
WillP
WillP@wwil83·
TSLA is currently in a bearish trend, as indicated by the ACL (BEAR) and MACRO (bearish) signals. The stock price is $363.11, down 2.42% in the last 24 hours, with a neutral RSI of 38.7. Given the current ranging BMS and cold MICRO signals,near term price range for TSLA $350-$380
WillP tweet mediaWillP tweet mediaWillP tweet media
English
0
0
0
41
WillP
WillP@wwil83·
BZ=F (Brent Crude Oil) is currently trading at $103.65 with a 24-hour loss of 4.04%. The overall outlook is bullish, supported by a BMS breakout signal and a hot micro trend, despite a neutral sentiment. With an RSI of 74.2, the asset may be due for a correction, Still bullish.
WillP tweet mediaWillP tweet mediaWillP tweet media
English
0
0
0
61
Wick
Wick@ZeroHedge_·
$BTC That was the easiest top to spot ever. Stage 3 basing with lower high and squeeze shading right into breakdown arrow.
Wick tweet media
English
23
14
202
15K
WillP
WillP@wwil83·
ETH: Current price: $2068.55 * 24h change: -4.59% * ACL: BEAR * MACRO: bearish * BMS: ranging * MICRO: cold * RSI: 35.9 * Sentiment: neutral. watch for a breakdown below the floor level or a bounce off the ceiling level to determine the next direction.
WillP tweet mediaWillP tweet mediaWillP tweet media
English
0
0
0
39
WillP
WillP@wwil83·
BTC: Current price: $69264, down 2.75% in 24 hours * Trend indicators: ACL is BEAR, MACRO is bearish, BMS indicates breakdown * Market sentiment: MICRO is cold, RSI is 34.9, overall sentiment is neutral. Watch for a potential test of the floor pivot level.
WillP tweet mediaWillP tweet mediaWillP tweet media
English
0
0
0
47
WillP
WillP@wwil83·
SOL: Current price: $93.0 with a 2.40% increase in the last 24 hours * Market signals: + ACL: BEAR + MACRO: bearish + BMS: breakdown + MICRO: cold + RSI: 37.0 + Sentiment: neutral This suggests a cautious approach to SOL due to the bearish ACL and MACRO signals.
WillP tweet mediaWillP tweet mediaWillP tweet media
English
0
0
1
47
WillP
WillP@wwil83·
Looking at FET, it's starting to generate some steam, Current price: $0.258 with a 6.79% increase in the last 24 hours * Market signals: ACL is Turning BULLLISH, MACRO is bearish, BMS is ranging, and MICRO is steady * Key indicators: RSI is 46.1, and sentiment is greed.
WillP tweet mediaWillP tweet mediaWillP tweet media
English
0
0
0
44
WillP
WillP@wwil83·
Where to next, 3D death cross just happened, chart says we are bearish, do we hold then rally or roll over and drop?
WillP tweet media
English
0
0
0
27
WillP
WillP@wwil83·
@GordonGekko Agree, but #sol ain't riding that wave up this bull run. Maybe the next. #btc has made a death cross already and is making another most likely this weekend 21ma over the 50ma on the weekly. Zoom out look at history. Sol follows the big fella.
English
1
0
3
82
Gordon 🐂
Gordon 🐂@GordonGekko·
Just stack as much $SOL as you can under $200. The lower the better. Then sell at $1000. Easy.
Gordon 🐂 tweet media
English
170
53
642
46.6K
Crypto Crew University
Crypto Crew University@CryptoCrewU·
NVT/HV doesn’t lie. Lower highs since 2013 = long-term compression. These moments don’t happen often. Zoom out and tell me what you see. 👇📉 #Volatility #BTC
Crypto Crew University tweet media
English
34
20
150
16.1K
WillP
WillP@wwil83·
@NoLimitGains He can't read that chart though.. Benner suggests good times.. Only reason people will loose money is if they get to greedy before it all pops.
English
0
0
2
120
NoLimit
NoLimit@NoLimitGains·
🚨 THIS IS VERY, VERY BAD!! I spent days looking at where the global financial system is heading… And next year will be rough. 97% of people will lose EVERYTHING in 2026. Not because of a classic recession or a bank run. It’s something much bigger than that, let me explain: In sovereign bond markets, especially U.S. Treasuries. Bond volatility is already starting to wake up. The MOVE index has been creeping higher, and historically that doesn’t happen without a reason. Bonds don’t move on vibes or narratives but they move when funding conditions are starting to tighten. What makes this worrying is that three major fault lines are lining up at the same time: First, the U.S. Treasury. In 2026, the U.S. has to roll and issue an enormous amount of debt while running massive deficits. At the same time, interest costs are exploding, foreign buyers are stepping back, dealers are more balance-sheet constrained than ever, and long-end auctions are already showing signs of stress. Bigger tails, weaker demand, less appetite to absorb supply. That’s not a theory, it’s already visible in the data. This is how funding shocks start. Not with panic, but with auctions that quietly struggle. Second, we have Japan. Japan is the largest foreign holder of U.S. Treasuries and the backbone of global carry trades. If USD/JPY keeps pushing higher and the Bank of Japan is forced to react, carry trades unwind fast. When that happens, Japanese institutions don’t just sell domestic assets… They sell foreign bonds too. That loop puts even more pressure on U.S. yields right when the Treasury needs demand the most. Japan doesn’t cause the shock by itself. It amplifies it. Third, we have China. Behind the scenes is a massive local-government debt problem that hasn’t gone away. If stress there turns into a visible credit event, the yuan weakens, capital looks for safety, commodities react, and the dollar strengthens. That feeds directly back into higher U.S. yields again. China becomes another amplifier, not the origin. The trigger for all of this doesn’t need to be dramatic. It could be something as simple as a poorly received 10-year or 30-year Treasury auction. One bad auction at the wrong time is enough to spike yields, tighten global funding, and force risk assets to reprice quickly. We’ve seen this movie before, the UK gilt crisis in 2022 followed this exact path. The difference now is scale. This time, it’s global. If that kind of funding shock hits, the sequence is fairly predictable: long-term yields jump, the dollar strengthens, liquidity dries up, risk assets sell off hard, and volatility spreads everywhere. That’s not a solvency crisis, it’s a plumbing problem. But plumbing problems move fast. And then comes the response. Central banks step in. Liquidity gets injected. Swap lines open. Buybacks and balance sheet tools come back into play. The system stabilizes but at the cost of another wave of liquidity. That’s when the second phase starts. Real yields fall, hard assets catch a bid, gold breaks higher, silver follows, Bitcoin recovers, commodities move, and the dollar eventually rolls over. The shock clears the way for the next inflationary cycle. That’s why 2026 matters… Not because everything explodes permanently, but because multiple stress cycles peak at the same time. And the early signal is already there. Bond volatility doesn’t rise early by accident. The world can handle recessions… but what it struggles with is a disorderly Treasury market. That’s the risk building beneath the surface and it’s worth paying attention to long before it shows up. I was one of the only people who called the top in October, and I’ll do it again, that’s literally my job. Pay close attention. Alot of people will wish they followed me sooner.
NoLimit tweet media
English
466
1.4K
6.3K
1.1M
WillP retweetledi
Julien Bittel, CFA
Julien Bittel, CFA@BittelJulien·
I wanted to give everyone something meaningful, a gift… This comes from Global Macro Investor (GMI) and a deep, long-running body of research developed by @RaoulGMI and myself. Many of you already know The Everything Code, which is our framework for understanding the macro landscape and why major central banks are debasing their currencies to manage aging demographics and overwhelming debt loads. I call this a gift because these four charts, while only scratching the surface of The Everything Code, give you the big-picture context you actually need in moments like this. They stop you from getting lost in every Bitcoin pullback and explain why Raoul and I never panic, even when, to borrow one of his expressions, everyone’s acting like monkeys throwing poo at each other. Once you understand The Everything Code, you stop trading short-term noise and expand your time horizon. You cannot unsee it. The starting point is what we call The Magic Formula: GDP growth = population growth + productivity growth + debt growth. Population growth and productivity growth have been falling for decades. Debt growth is the only thing filling the gap. The private sector has been deleveraging since 2008, mainly households, but debt levels are still around 120% of GDP. The public sector sits at roughly the same level. Here’s the problem… If the government is running debt at 100% of GDP and the private sector is sitting on another 100%, and for simple math we call rates 2% even though they are really closer to 4%, then the entire 2% trend growth of the economy is being consumed by servicing private-sector debts. That is a completely unproductive use of GDP. And then there’s the issue of public-sector debts. There’s just not enough organic growth to service the existing debt load. To understand why this dynamic persists, you need demographics. Birth rates peaked in the late 1950s and have been declining ever since. This shows up about sixteen years later in the labor force participation rate as each generation enters the workforce (chart 1). That means the labor force participation rate is not going to rise any time soon. It is set to keep drifting lower. This is a structural problem. Aging populations, falling birth rates, and rapidly expanding automation make the backdrop even more deflationary. AI and robotics are replacing humans at scale, and we are only at the beginning. This reinforces the need for ongoing stimulus to keep the system functioning. With weak population growth and sluggish productivity, the only way to keep GDP expanding is through debt. Now here’s where it gets interesting… Government debt growth is completely offsetting the demographic decline and policymakers know exactly what they are doing (chart 2). And what happens next? All debt growth in excess of GDP gets monetized (chart 3). Basically, since 2008, magic money has effectively been paying the interest. Governments issue new debt to cover old interest, and once rates fall enough, central banks absorb it onto their balance sheets. So to wrap this up, demographics drive the decline in the labor force. Governments offset that decline with more debt. That debt eventually gets monetized through quantitative easing (QE) style operations, not always directly by the Fed, but through the coordinated ecosystem of the Fed, the Treasury, and the banking system. And the bottom line is that there’s still a massive wall of interest that needs to be monetized, far more than GDP can ever cover. Liquidity is literally the only game in town. And what thrives in a world of perpetual debasement? Bitcoin (chart 4). I know this correction has been painful, but it’s all part of the journey. These periods feel brutal in the moment, then they fade and the trend resumes. This too shall pass… To quote Walter White from Breaking Bad, later echoed by @LynAldenContact, nothing stops this train. MOAR COWBELL (liquidity) = number go up over time. Zoom out and be more bullish…
Julien Bittel, CFA tweet mediaJulien Bittel, CFA tweet mediaJulien Bittel, CFA tweet mediaJulien Bittel, CFA tweet media
English
194
558
3.3K
362.7K