Tweet fixado

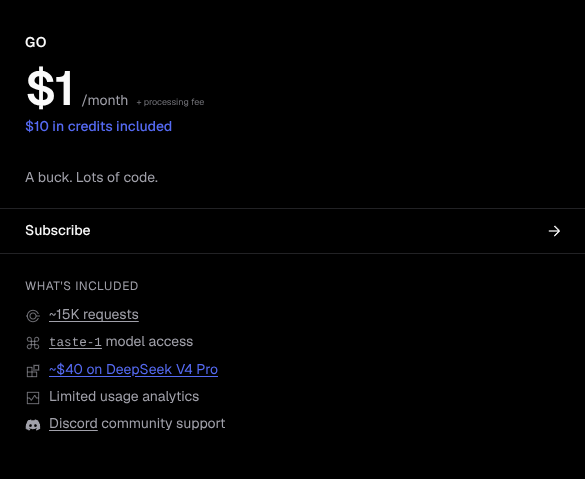
A dollar for $40 of DeepSeek V4 Pro usage?
Hard to say no to that.
English
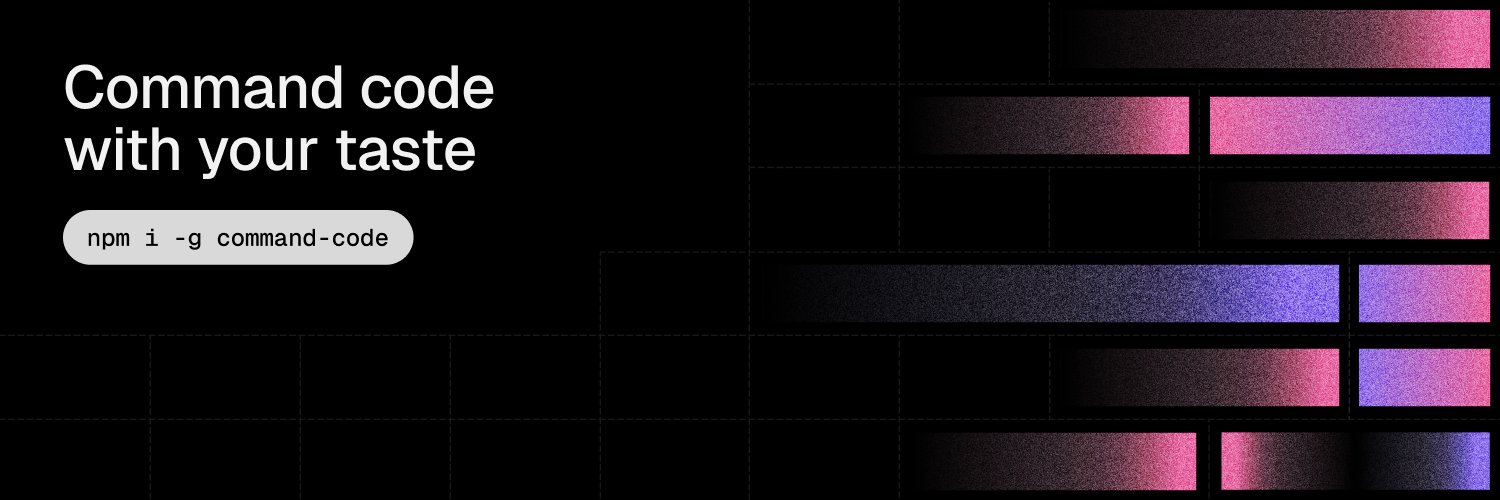
Command Code
3.1K posts
@CommandCodeAI
Command Code with taste; the first coding agent that observes how you write code and adapts to your preferences over time with meta neuro-symbolic AI `taste-1`.


how did we make deepseek outperform opus 4.7? i've been thinking about why "open model bad at tool calling" is almost always a harness problem, not a model problem. context: spent the two days looking at billions of tokens in @CommandCodeAI (tb open source ai cli) using deepseek. I ended up writing a tool-input repair layer. the trigger was watching deepseek-flash fail on the simplest /review run, every shellCommand and readFile call bouncing back with a raw zod issues blob, the model unable to recover because the error wasn't in a form it could read. by the end deepseek v4 pro was beating opus 4.7 6/10 times on our internal evals. a few things i learned that feel general: 1/ the failure modes aren't random they're a small finite compositional set. across deepseek-flash, deepseek v4 pro, glm, qwen, the same four mistakes repeat almost exactly: - sending `null` for an optional field instead of omitting it - emitting `["a","b"]` as a json *string* instead of an actual array - wrapping a single arg in `{}` where the schema expected an array (an "empty placeholder") - passing a bare string where an array was expected (`"foo"` instead of `["foo"]`) four repairs, ~30-100 lines each, ordered carefully (json-array-parse must run before bare-string-wrap or `'["a","b"]'` becomes `['["a","b"]']`). that is the whole catalogue. when i hear "this open source model can't do tool calls" i now assume one of those four, and so far that's been right ~90% of the time. 2/ the funniest failure mode is also the most revealing. deepseek-flash, when asked to edit or write a file, sometimes emits the path as a *markdown auto-link*: filePath: "/Users/x/proj/[notes.md](http://notes. md)" our writeFile tool obediently trued creating files literally named `[notes.md](http://notes .md)` until we caught it. this is not a hallucination. it's the post-training chat distribution leaking through the tool boundary the model has been rewarded for auto-linking in conversational output, and is applying that prior in a context where it makes no sense. the fix is two regex lines that unwrap only the degenerate case where link text equals url-without-protocol real markdown like `[click](https://x .com)` passes through untouched. this is also conditioning of their own tools during RL which were different from all other tools we write and ofc can't predict. "tool confusion" is a more useful frame than "capability gap." the model knows how to format a path. it just hasn't been told clearly enough that this path is going to fopen, not into a chat bubble. so we encode that hint at the schema level `pathString()` instead of `z.string()` and the leak is plugged for every path field at once. 3/ the design choice that mattered was inverting preprocess-then-validate to validate-then-repair. my first attempt was the obvious one: a preprocessing pass that normalized inputs (strip nulls, parse stringified arrays, etc.) before zod ever saw them. it broke immediately, writeFile content that *happened* to be json-shaped got rewritten before it hit disk. silent corruption, easy to miss in a smoke test. then i made it less greedy - parse the input as-is. if it succeeds, ship it. valid inputs are never touched. - on failure, walk the validator's own issue list. for each issue path, try the four repairs in order until one applies. - parse again. on success, log `tool_input_repaired:${toolName}`. on failure, log `tool_input_invalid:${toolName}` and return a model-readable retry message. the structural insight here is: when you preprocess, you encode a prior about what's broken. when you let the validator complain first, the schema is the prior, and you only spend repair budget at the exact paths the schema actually disagreed at. the validator is doing the work of localizing the bug for you. it's the same shape as cheap-then-careful everywhere else try the fast path, fall back on evidence. (this also gives you per-tool telemetry for free. you can watch repair rates per (model, tool) and notice when a model regresses on a specific contract before users do.) 4/ shape invariants and relational invariants need different fixes. the four repairs above all handle shape problems wrong type, missing key, wrong container. but read_file had a *relational* invariant: "if you provide offset, you must also provide limit, and vice versa." deepseek kept calling `readFile({ absolutePath, limit: 30 })` and getting an `ERROR:` back. you can't fix this with input repair, because each field is independently valid the bug is in the relationship between them. so i taught the function the model's intent instead. `limit` alone → `offset = 0`. `offset` alone → `limit = 2000` (matches common read tool ops default). then surfaced the decision back to the model in the result: "Note: limit was not provided; defaulted to 2000 lines. To read more or fewer lines, retry with both offset and limit." no `Error:` prefix, so the tui doesn't paint it red. the model sees what we picked and can self-correct on the next turn if our guess was wrong. transparency over silent magic wins big. repair where you can. extend semantics where you can't. surface the choice either way. zoom out: a lot of what looks like model capability is actually contract design. a strict schema is a choice with a cost it filters out noise, but it also filters out recoverable noise from any model that hasn't memorized the exact json contract you happened to pick. the largest commercial models eat that cost invisibly and are linient on tool calling because they've seen enough of every contract during pretraining; open models pay it loudly and get dismissed for it. the harness is where you mediate between distributions. four small repairs (i'm sure more to follow as we have three more merging today), two regex lines for auto-links, one relational default, one prefix change. the model didn't change. the contract got more forgiving in exactly the places it needed to be. deepseek v4 pro now beats opus 4.7 6/10 times on our internal evals. imo "skill issue" applies to the harness more often than the model.


how did we make deepseek outperform opus 4.7? i've been thinking about why "open model bad at tool calling" is almost always a harness problem, not a model problem. context: spent the two days looking at billions of tokens in @CommandCodeAI (tb open source ai cli) using deepseek. I ended up writing a tool-input repair layer. the trigger was watching deepseek-flash fail on the simplest /review run, every shellCommand and readFile call bouncing back with a raw zod issues blob, the model unable to recover because the error wasn't in a form it could read. by the end deepseek v4 pro was beating opus 4.7 6/10 times on our internal evals. a few things i learned that feel general: 1/ the failure modes aren't random they're a small finite compositional set. across deepseek-flash, deepseek v4 pro, glm, qwen, the same four mistakes repeat almost exactly: - sending `null` for an optional field instead of omitting it - emitting `["a","b"]` as a json *string* instead of an actual array - wrapping a single arg in `{}` where the schema expected an array (an "empty placeholder") - passing a bare string where an array was expected (`"foo"` instead of `["foo"]`) four repairs, ~30-100 lines each, ordered carefully (json-array-parse must run before bare-string-wrap or `'["a","b"]'` becomes `['["a","b"]']`). that is the whole catalogue. when i hear "this open source model can't do tool calls" i now assume one of those four, and so far that's been right ~90% of the time. 2/ the funniest failure mode is also the most revealing. deepseek-flash, when asked to edit or write a file, sometimes emits the path as a *markdown auto-link*: filePath: "/Users/x/proj/[notes.md](http://notes. md)" our writeFile tool obediently trued creating files literally named `[notes.md](http://notes .md)` until we caught it. this is not a hallucination. it's the post-training chat distribution leaking through the tool boundary the model has been rewarded for auto-linking in conversational output, and is applying that prior in a context where it makes no sense. the fix is two regex lines that unwrap only the degenerate case where link text equals url-without-protocol real markdown like `[click](https://x .com)` passes through untouched. this is also conditioning of their own tools during RL which were different from all other tools we write and ofc can't predict. "tool confusion" is a more useful frame than "capability gap." the model knows how to format a path. it just hasn't been told clearly enough that this path is going to fopen, not into a chat bubble. so we encode that hint at the schema level `pathString()` instead of `z.string()` and the leak is plugged for every path field at once. 3/ the design choice that mattered was inverting preprocess-then-validate to validate-then-repair. my first attempt was the obvious one: a preprocessing pass that normalized inputs (strip nulls, parse stringified arrays, etc.) before zod ever saw them. it broke immediately, writeFile content that *happened* to be json-shaped got rewritten before it hit disk. silent corruption, easy to miss in a smoke test. then i made it less greedy - parse the input as-is. if it succeeds, ship it. valid inputs are never touched. - on failure, walk the validator's own issue list. for each issue path, try the four repairs in order until one applies. - parse again. on success, log `tool_input_repaired:${toolName}`. on failure, log `tool_input_invalid:${toolName}` and return a model-readable retry message. the structural insight here is: when you preprocess, you encode a prior about what's broken. when you let the validator complain first, the schema is the prior, and you only spend repair budget at the exact paths the schema actually disagreed at. the validator is doing the work of localizing the bug for you. it's the same shape as cheap-then-careful everywhere else try the fast path, fall back on evidence. (this also gives you per-tool telemetry for free. you can watch repair rates per (model, tool) and notice when a model regresses on a specific contract before users do.) 4/ shape invariants and relational invariants need different fixes. the four repairs above all handle shape problems wrong type, missing key, wrong container. but read_file had a *relational* invariant: "if you provide offset, you must also provide limit, and vice versa." deepseek kept calling `readFile({ absolutePath, limit: 30 })` and getting an `ERROR:` back. you can't fix this with input repair, because each field is independently valid the bug is in the relationship between them. so i taught the function the model's intent instead. `limit` alone → `offset = 0`. `offset` alone → `limit = 2000` (matches common read tool ops default). then surfaced the decision back to the model in the result: "Note: limit was not provided; defaulted to 2000 lines. To read more or fewer lines, retry with both offset and limit." no `Error:` prefix, so the tui doesn't paint it red. the model sees what we picked and can self-correct on the next turn if our guess was wrong. transparency over silent magic wins big. repair where you can. extend semantics where you can't. surface the choice either way. zoom out: a lot of what looks like model capability is actually contract design. a strict schema is a choice with a cost it filters out noise, but it also filters out recoverable noise from any model that hasn't memorized the exact json contract you happened to pick. the largest commercial models eat that cost invisibly and are linient on tool calling because they've seen enough of every contract during pretraining; open models pay it loudly and get dismissed for it. the harness is where you mediate between distributions. four small repairs (i'm sure more to follow as we have three more merging today), two regex lines for auto-links, one relational default, one prefix change. the model didn't change. the contract got more forgiving in exactly the places it needed to be. deepseek v4 pro now beats opus 4.7 6/10 times on our internal evals. imo "skill issue" applies to the harness more often than the model.


MiniMax M3 is now permanently 50% off on CommandCode!
