
Rade_Radovic
17 posts

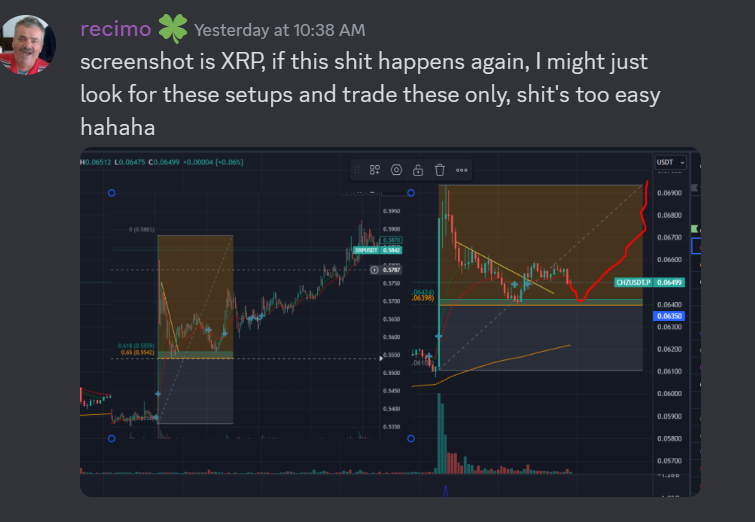
Bro watched one scalping session of mine on $XRP, and then Pico Bottoms $chz twice.. So funny.
Why do I use these ideas? Because I have studied EVERYTHING that has been traded the last 100 years. On all timeframes. These ideas appear on every asset.
Its time to understand how the markets moves and why.

Lucky Chart Ape@luckychartape
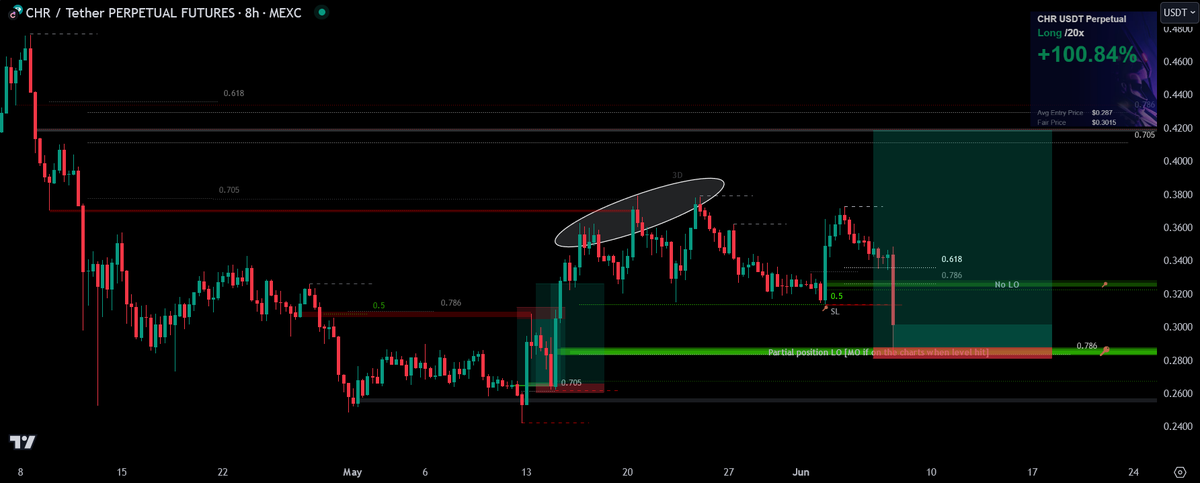
This is pretty F'ing dope. A member spotted the exact same LTF setup on $CHZ as the one from several weeks ago after the initial impulse on $XRP. Had to should him out 1st image, his chart. 2nd image, me notifying everyone of the idea (and adding channel) 3rd image the live chart.
English
@DailyCryptoTrad You just tell the truth and telling the truth is crazy in a world Full of lies, like Kanye would say
English

Gotta love the crypto space. They caught yesterday's move, but here at DCT, we’ve been ahead of the curve since May, 3 months before the herd. We called the local top at 72k and the local bottom at 49k back then. Yet, those so-called "CT" folks always act like they’re never wrong, right? I got called all kinds of names for my "crazy" TA, yet here we are.
$BTC #cryptocurrency #bitcoin

Daily Crypto Trading@DailyCryptoTrad
Time for a Short-Term Update on Bitcoin! So far, everything is going according to plan, but in the short term, two possible scenarios can play out. Let's jump straight into it: 1. Scenario 1: Short-Term Pullback We might see a short-term pullback towards the 52-42k range, which aligns with our Fibonacci level of 1.618. This would also be my personal LONG setup. Right after this pullback, we could have a bullish continuation trend, as the chart shows. This scenario aligns with my Elliott Wave count from December and my current long-term TA. If we break the golden ratio around 65-63k, it would confirm our TA. We might form a double top around the Fibonacci level of 1.618 at 74k and then experience a pullback. However, this scenario would be invalidated if we push through 74k and hold it as support for a few days (it's important that this is not a fake breakout). We need to see if it holds as support. 2. Scenario 2: Breaking the Old ATH If we break through the old ATH and HOLD it as support for a few days, then we would likely see a continuation and move towards the Fibonacci level of 2.618, around 86k. After that, we will readjust our TA. All of these scenarios would be invalidated if a recession hits. $BTC
English

Gm and happy Sunday! ☀️
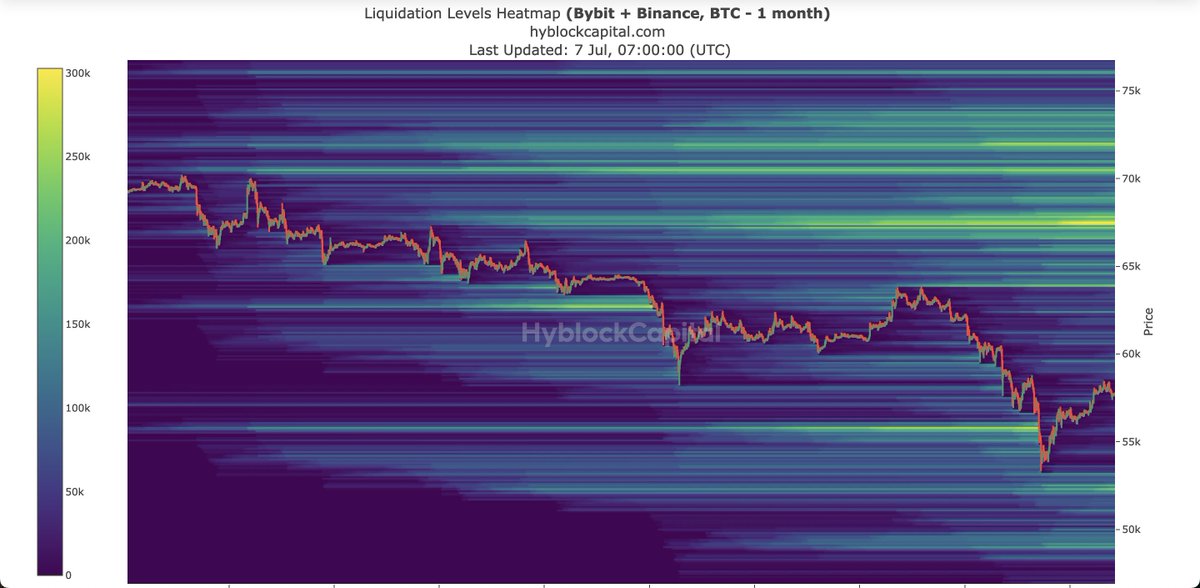
Bitcoin update & Hyblock Heatmaps
BTC consolidation over the weekend between 56k support and old range low as resistance.
It is quite possible that Bitcoin will continue to pump today like it did last weekend, but then quickly close the CME gap at the beginning of the week.
This would still be very bullish, as today is the weekly close and, of course, the higher, the better.
However, the former range low is likely to be a very strong resistance, and as I mentioned, volume-wise, I don't yet see this as a V-shaped reversal.
If we see weakness under the resistance today and early next week, I still strongly believe that we will hit 52k or even the monthly level lower at 48/49k with a wick, and then see corresponding volume there.
So, what can we expect for today?
-> It all depends on the reaction at the current price level!
Will Bitcoin attempt to break the resistance, or will the price be rejected, and if so, how strongly?
Or in other words: the short-term trend is up and the medium-term trend is down. Which trend prevails will be decided at this resistance.
Have a great Sunday and see you soon! ☀️
PS: Last day of the 1 SOL for 1 active Gm-replyooor giveaway - picking the winner in tomorrow's update!


English
@Alexander_KK888 @eliz883 You can increase leverage afterwards and take Money out of the Position to use it in another trade. If you Open the Position with 1000€ and increase lev to 10x you only Need 100€ to hold that Position and the other 900 can be used for another Trade
English


@Moneytaur_ Wow now i definetely Unterstand how quick these levels are going to take and what you mean by find and wait . Had the Same FVG but didn‘t Placed an Order. Would you say that these moves happen with higher probability on days with Important data? 😄
English

CHR [Update]
1st "No LO" level ignored. No position in play.
The more optimal 🔑 level hit perfectly into partial position [0.75%] and no time to MO.
SL2BE.
Thank you for playing 🥂
🎯 Master@Moneytaur_
CHR [short-term]
English
Anyone knows where we can have copy trading services of these OG traders? Also Nancy Pelosi.
Asking for a friend
Insider Tracker@TrackInsiders_
🚨New Tommy Tuberville trades just disclosed Seeing a lot of selling among congress members right now Any idea why?
English

Nur noch fünf Tage bis zur finalen Entscheidung über den ETF und um meine 100k Follower auf Twitter zu feiern, starte ich ein exklusives Gewinnspiel: $2500 USDT aufgeteilt an 10 glückliche Gewinner! 🎉
So nimmst du teil 👇🏻
Schritt 1) Folge mir, retweete und like diesen Tweet.
Schritt 2) Kommentiere unter diesem Tweet deine Ethereum-Adresse (ERC20) - sei es deine Börsen-Einzahlungsadresse, deine Hardware-Wallet oder eine Wallet wie Metamask.
Schritt 3) Retweete und like den angepinnten Tweet auf meinem Profil (bit.ly/pinned-hoss).
In 5 Tagen ziehe ich in einem Video/Livestream zufällig und fair die Gewinner über ein Tool und sende die USDT direkt zu euch. Super simpel, also macht gerne alle mit!
Die einzige Regel ist, dass Bots nichts zählen. Bei Auflösung werden die Accounts von mir überprüft. Alles was nicht menschlich aussieht wird disqualifiziert.
Euer Support bedeutet mir viel, und mit diesem kleinen Dankeschön möchte ich etwas an euch zurückgeben!
Danke an Jeden & bis auf die nächsten 100k! 🤍

Deutsch
$XLM (Update)
Re-entry @ riskier (due to lack of confirmations) double top after -35% SL with 1st attempt.
Trailing > +35% for BE play as worst case scenario, aka. risk management.
$0,099 is a semi-optimal opportunity in my opinion (whenever it happens), unless #Bitcoin's 🩸 hard once XLM is at that level.

🎯 Master@Moneytaur_
$XLM (Update)
English
@AllBlackPassion @DrLoupis I think they do that but not everywhere i guess it’s an expensive
process
English


You can’t recycle wind turbines. So they bury them.
Stop climate scam!! 🚨🚨🚨🚨

English


Here is another one from weeks ago. There were so many signs. The problem is the hopium always gets the best of them. Just wait for the next drop. Thats going to be a FUN one! DM for access to my FREE Telegram so I can send you an invite link.
Bleeding Crypto@Bleeding_Crypto
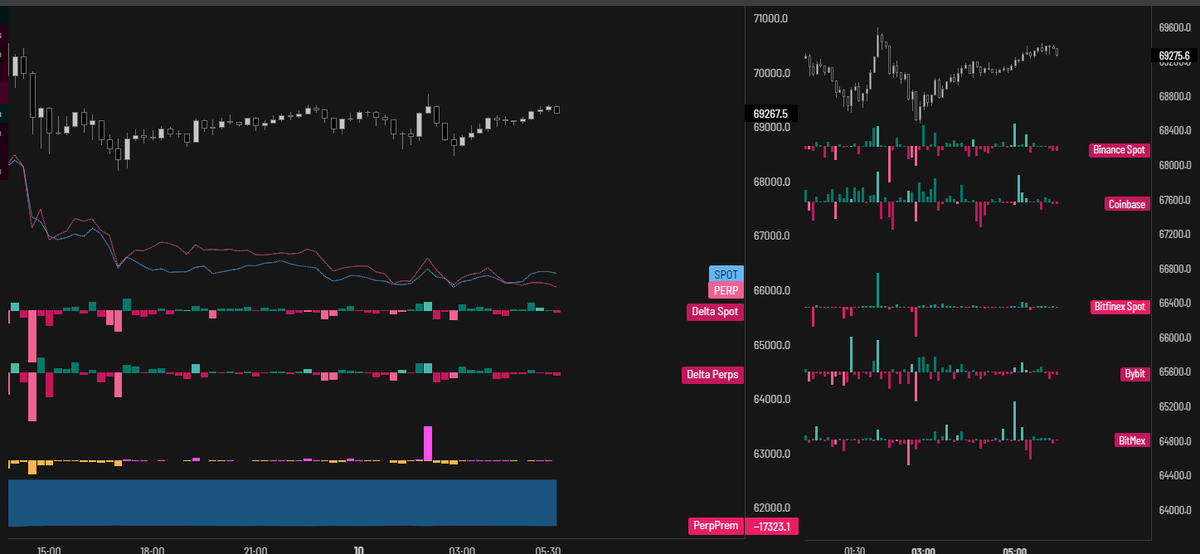
$BTC Here is a simple chart to show you whats coming. You see that gap in the VRVP? that Gap will most likely get filled. You can either get in front of it and make money off of that info, or you can watch from the sidelines. Its up to you! DM is you want free access to my TG
English
Italiano

@Numb_to_Fomo @explorer_algo What isthis page?
English

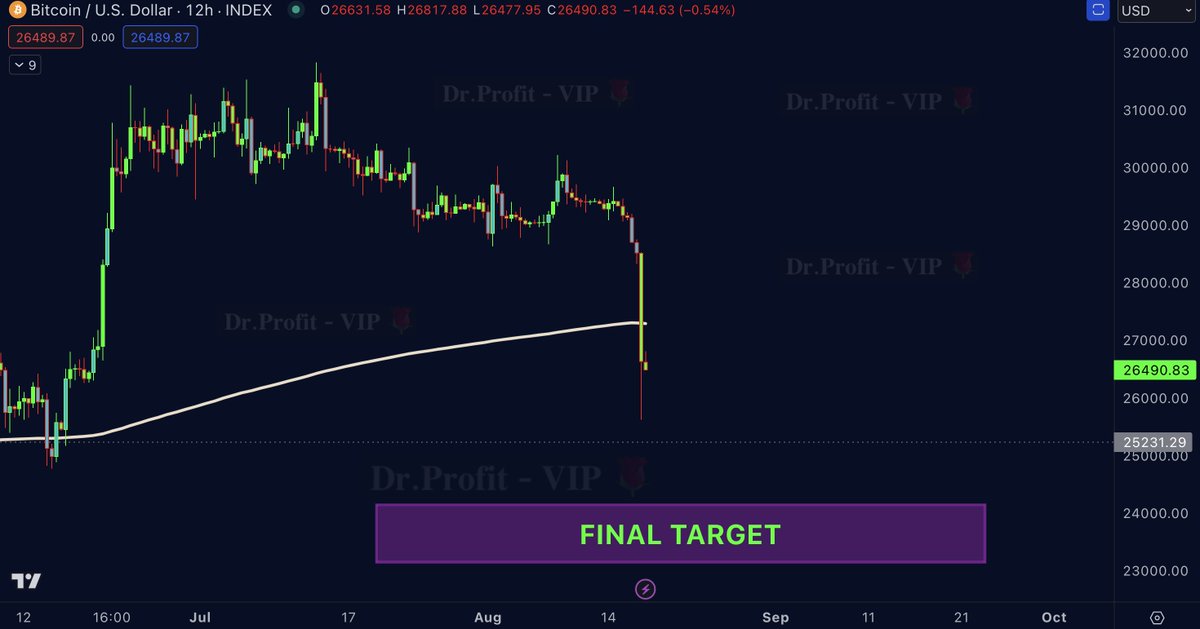
The dump is far from over
Placing many long orders in $23.5k - $24k region
Will take profit from 30-31k shorts in final target region
English
$BTC Here is a simple chart to show you whats coming. You see that gap in the VRVP? that Gap will most likely get filled. You can either get in front of it and make money off of that info, or you can watch from the sidelines. Its up to you! DM is you want free access to my TG

English
