Daily Crypto Trading@DailyCryptoTrad
🚨 Urgent: $BTC Top Imminent – Brace for a Blow-Off Top! 🚨
We have accurately predicted every target since 2023, and I have been clear that after reaching $100k+, we would be approaching a top. Now, after more than a year, we are finally here. We have nailed BTC targets at $43k, $50k, $60k, $73k, $48k, $82k, $89k, and $99k🎯. Nothing has changed in my long-term TA, and just because we reached my goal from $30k to almost $100k, I am not going to change my TA due to shifting sentiment. I remain true to my analysis until it is invalidated. This TA will show you the invalidation points and some of the last targets before a final drop.
I understand there will be people who will insult me or call me names, but I do not care about them. I care about my community. Remember, I do not get paid for sharing these free insights; they are my own opinions. Most so-called influencers are not traders and will brainwash you to have one bias while selling their VIP groups or shilling their tokens, which they get paid to do. In this channel, we never had one bias; we had different scenarios with different probabilities, and we have nailed every target as mentioned. Now, the final blow is nearing. Ask yourself why I went from super bullish to bearish now? While everyone else was calling for a $60k top, we were targeting $100k+. Everyone who followed me knew my target. I have not changed my stance; I always showed you the bullish target and the bearish scenario and was very clear that once we went from $30k to $100k+, we were nearing the top. This should not take you by surprise. See every TA I posted.
Before diving in, I’d appreciate your support with likes, reposts, and comments to help grow the channel and keep this content coming. These analyses take time, and your appreciation fuels the drive to keep sharing!
Macro Overview Recap:
If you haven’t already, check out my macro analysis on the inevitable recession. Understanding this is essential before diving into the charts.
Recession:
x.com/DailyCryptoTra…
Warren Buffet's Cash Pile:
x.com/DailyCryptoTra…
Bitcoin Charts Analysis:
Elliott Wave Theory:
My Elliott Wave (EW) analysis has been spot-on since late 2023 and hit all targets. However, I am recounting sub-wave 5 since the structure has changed. We have an impulsive wave 3 which is overextended and losing momentum. This does not mean we cannot reach $100k+, but we need to stay cautious. We need our pullback to sub-wave 4 around $75k-$81k to hold (Fibonacci level shows $84k-$80k). Once we complete wave 4, we have our last impulsive wave, meaning there is still some fuel left. We can sometimes form truncated waves, which means wave 4 won’t reach wave 5 or hit the old ATH and make a double top. But if we get a strong wave 5, we could see a 40-50% increase from the $80k level, reaching Fibonacci levels of 3.272 at $113k, 3.414 at $117k, and 3.618 at $121k. This would be the best-case scenario. The invalidation point is if we go over $130k; then, this gets invalidated, and a potential target at $170k can be reached, but we need structure to confirm this first.
Once traditional markets, especially the Nasdaq and S&P 500 tech stocks, correct, Bitcoin is likely to follow, leading to a blow-off top as mentioned. At that point, BTC could drop to $17k-$30k, depending on the peak. This would form a massive ABC corrective pattern with Fibonacci targets at $52k and $31k before finding a bottom. This scenario aligns with a recession-driven market decline.
Invalidation Points:
This scenario could be invalidated if:
1. Markets reset/correct after 1-2 years.
2. Geopolitical tensions or wars are avoided.
3. A recession is avoided.
4. No black swan events occur.
However, if even one of these factors plays out, a market crash becomes highly probable. Be open-minded about these possibilities; ultimately, it is YOUR job to protect your capital.
Weekly Chart:
• Volume: Low volume while price action is increasing – bearish signal.
• RSI: Overbought, showing a bearish divergence since April. This is a high probability given the overbought zone but could be invalidated if RSI reaches 90.
• RSI Stochastic: Overbought but can remain so for up to a month.
• MACD: Bullish momentum but losing its momentum, bullish cross, and lines above 0 are also bullish.
All indicators suggest BTC is gearing up for a blow-off top, but there is still some fuel left.
Daily Chart:
RSI: Consolidating and above 50 – bullish.
RSI Stochastic: Oversold – bullish.
MACD: Bearish momentum, bearish cross, lines above 0 bullish.
Volume: Weak – bearish.
The daily chart suggests a need for consolidation and finding solid support before another move up. A retracement is likely, aligning with our Elliott Wave (sub-Wave 4) expectation. We are getting overextended.
Liquidity and Liquidation Heatmap Insights:
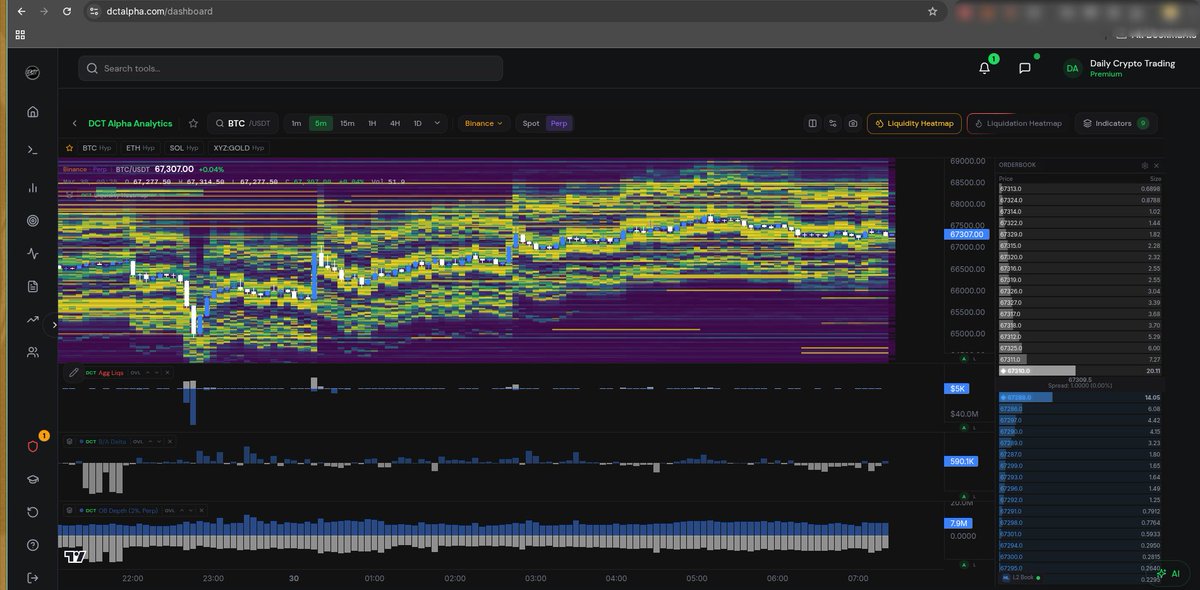
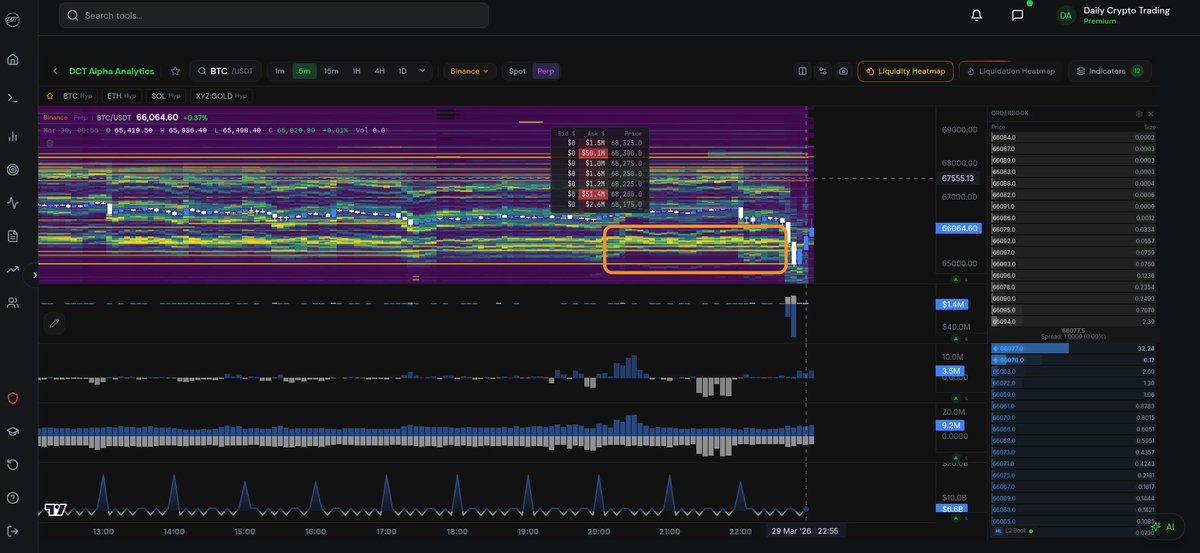
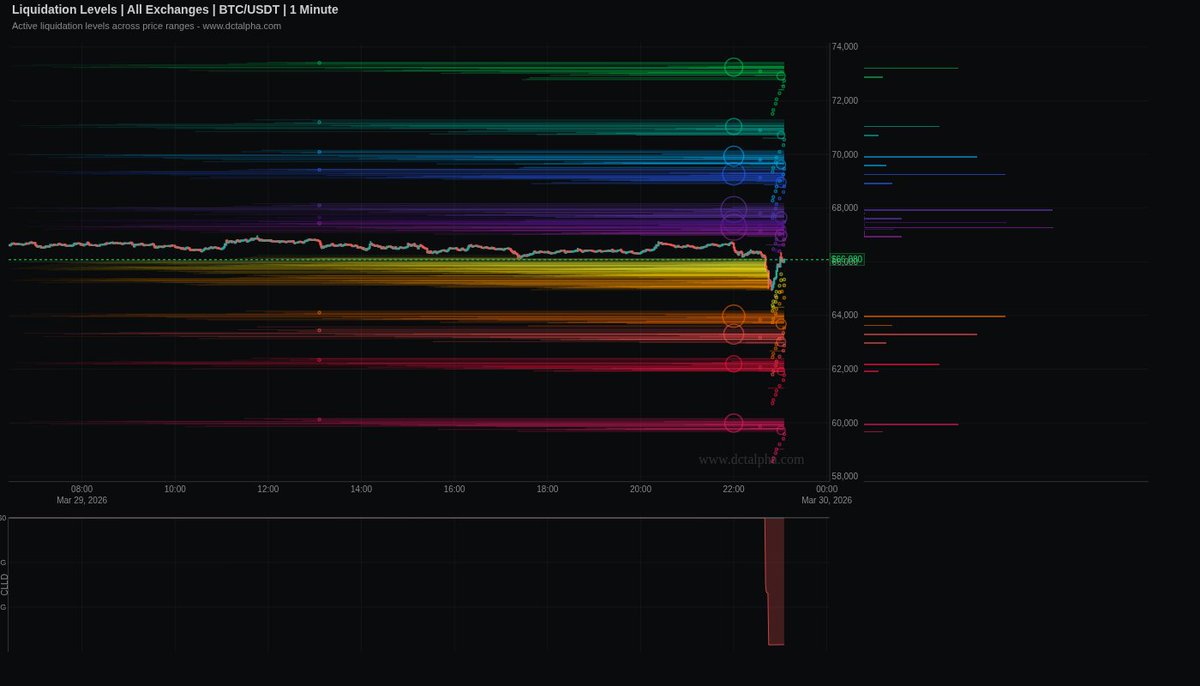
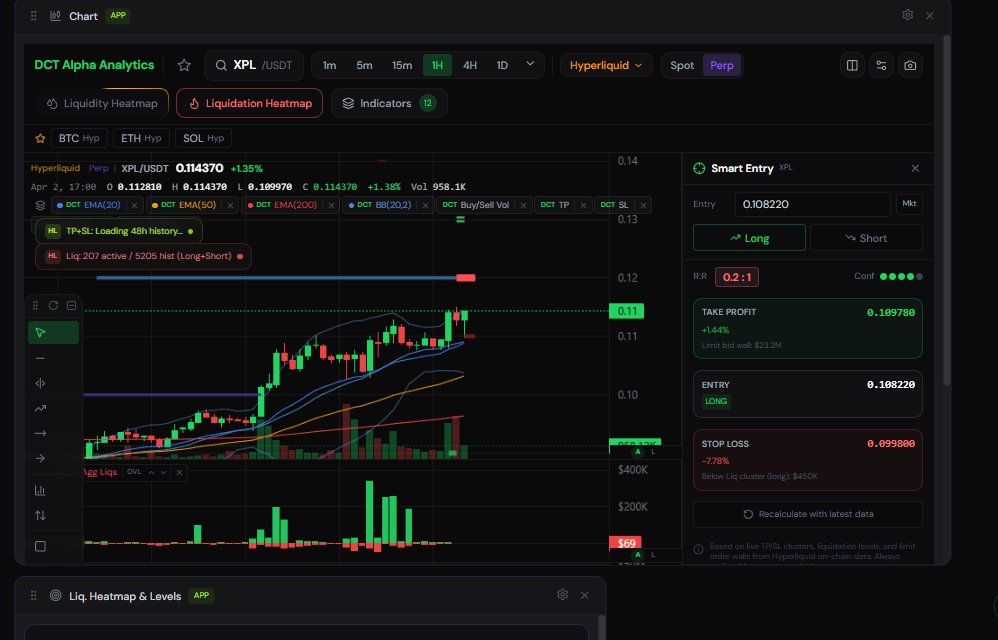
Our liquidity and liquidation heatmaps on TradingView reinforce this outlook, showing significant liquidity pools aligning with our targets. Access the same tools at Daily Crypto Trading.
Conclusion:
Based on my analysis, I firmly believe that BTC is approaching a top, with a likely range of $100k-$120k, especially if the Nasdaq and S&P 500 also peak. This outlook has been consistent since late 2023 and is supported by our Elliott Wave analysis and broader market trends.
However, several factors could disrupt this trajectory:
• Recession: As previously discussed, an economic downturn could align with a traditional market correction, significantly impacting BTC.
• Geopolitical Changes: Major shifts in global politics could introduce volatility, affecting market sentiment and BTC's price.
• Black Swan Events: Unforeseen events can always change market outcomes, as seen in past sudden market shifts.
• Market Shifts: Significant moves in traditional markets, such as those driven by geopolitical tensions or policy changes, could impact BTC.
if we avoid these factors, BTC has the potential to reach as high as $170k, as indicated by our Elliott Wave projections. The strong correlation between BTC and the tech sector suggests that a blow-off top is likely, especially with the current market boost from the "Trump Pump" driven by election cycles. However, potential trade wars or rate cuts could complicate this scenario.
In summary, while BTC could reach new highs, managing risk is crucial. The market is full of probabilities, not certainties. Although our targets have been accurate so far, future outcomes are never guaranteed. This analysis is meant to guide your understanding, but always verify and strategize based on your own judgment. #bitcoin #recession