Tweet fixado

Consider TechCharts Membership- Weekly Global Equity Reports, breakout alerts, Educational Video - Classic Charting. blog.techcharts.net

English
Aksel Kibar, CMT
42.1K posts

@TechCharts
Chartered Market Technician (CMT) and Classical chart trader. Ex- Fund manager. Premium membership ➡️ https://t.co/Y3Q8Y9Flke YouTube ➡️ https://t.co/GDPhOs0GwD


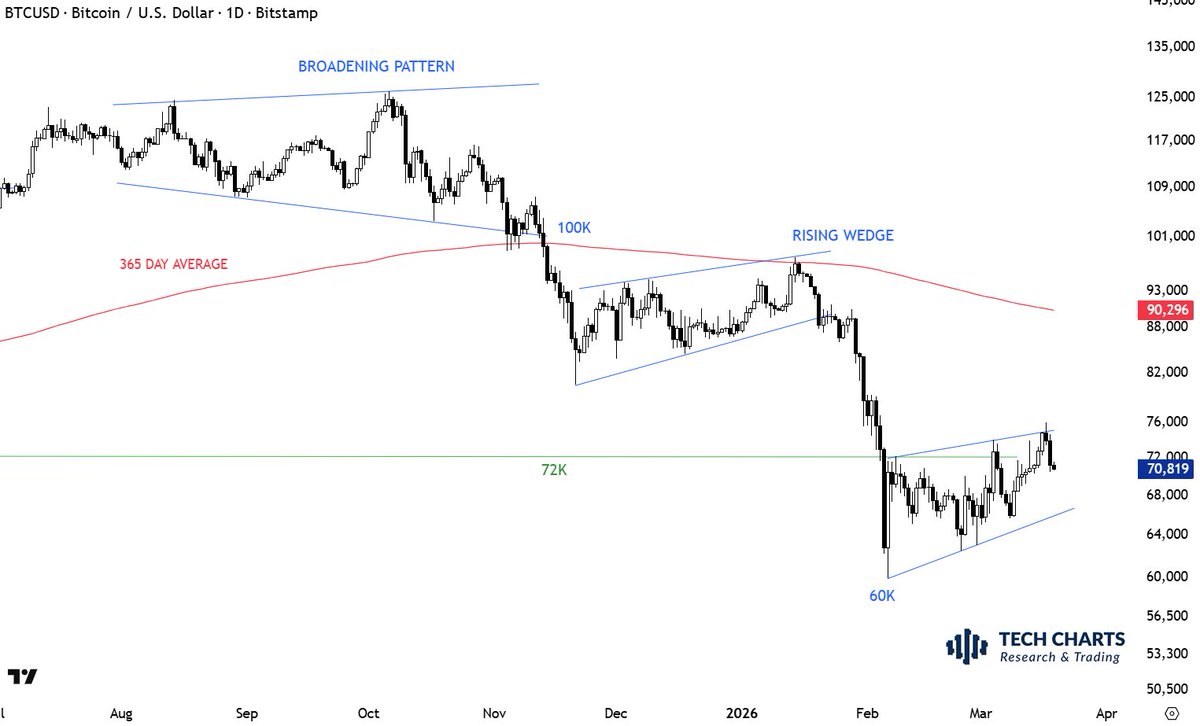
The consolidation below the long-term average. With cryptocurrencies I'm taking the 365 day EMA. With equities I take 200 day EMA as my year-long average trend filter. So far $BTCUSD respected the year-long average. This is part of the chop and search for a base. The pattern can become a rising wedge, usually bearish in an attempt to test 73.7K-76.5K support area.

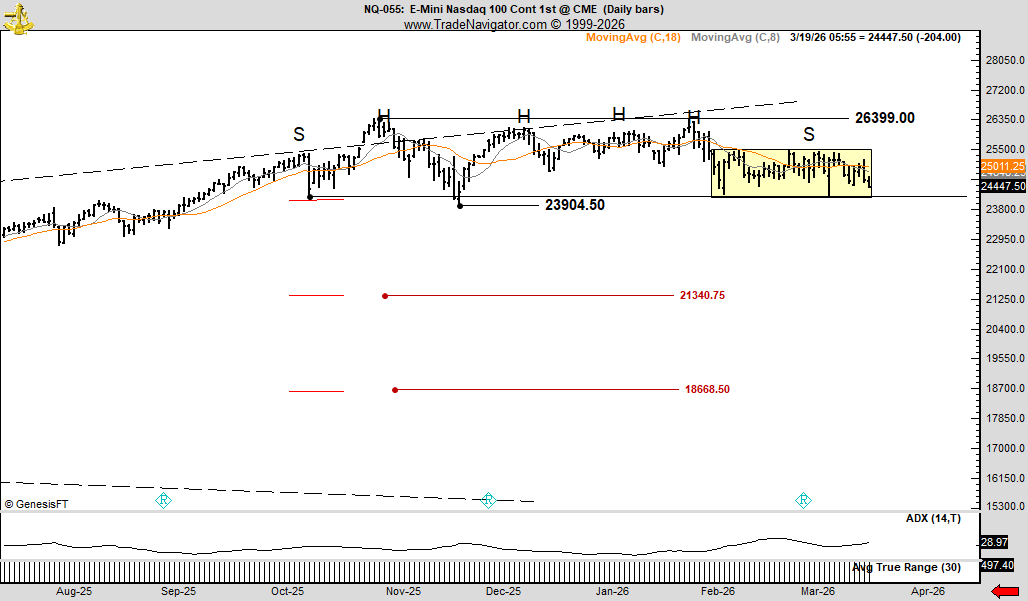
After a two-day rally, I took a short position in ES, not as a bet on economic collapse, but because the risk/reward looks favorable here. As I've laid out in recent reports, this aligns with my macro read across inflation, liquidity conditions, and labor dynamics, and serves as a practical hedge against existing long exposure, particularly positions with a much lower cost basis or limited liquidity. Note: reports have continued to feature a majority of "upside" trade setups in specific pockets of the market. I never want to make a career out of betting against American companies. Chances are that I'm wrong here. I hope so. We'll see.


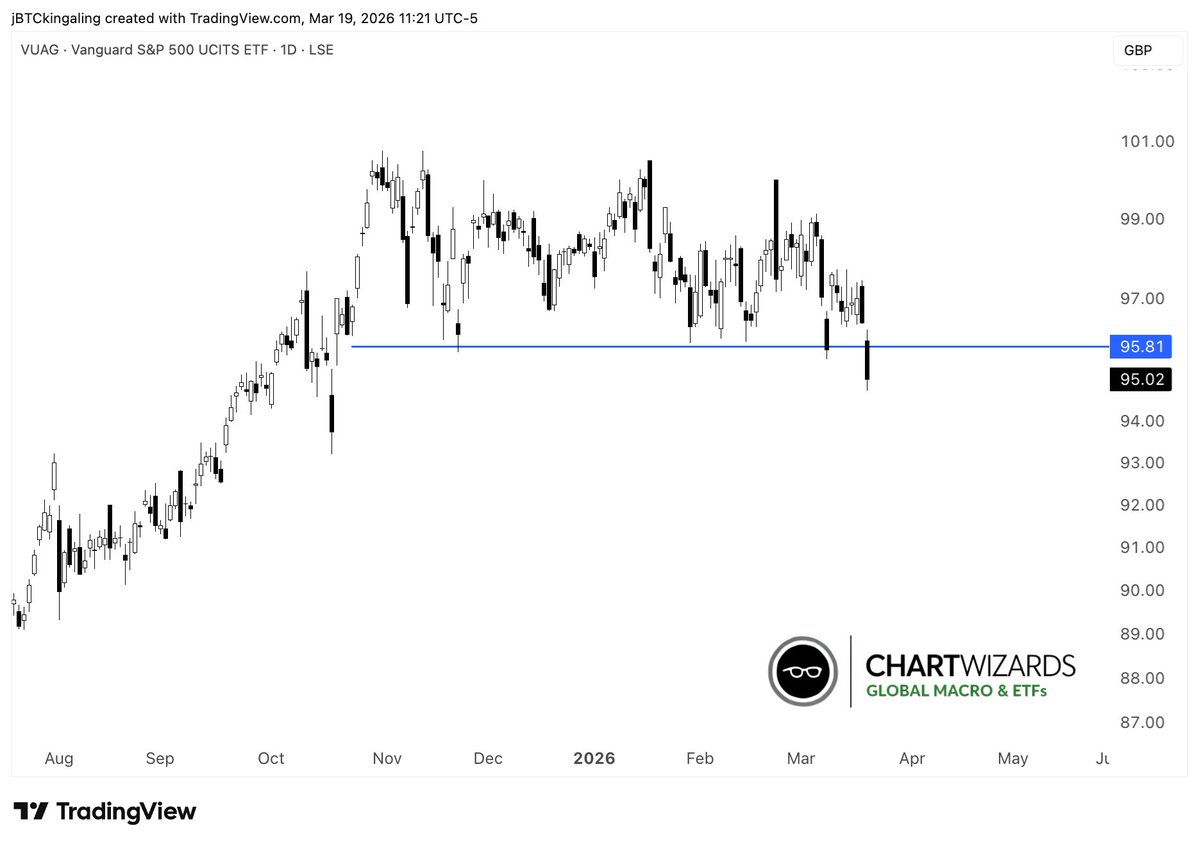
The impact of "operations", "geopolitical tensions", "regional wars" on Global markets have mostly been limited. When it becomes "economic" such as disruption of supply chains, long-term damage on infrastructure etc. then its a different situation. Markets will assess this risk in the following weeks. My guide will be the 200-day averages on many benchmarks. Are we holding above or breaking them down for a sustained downtrend?
Silver bootie $SI_F Today nearly 2years of world production traded on world exchanges More than 1.5 billion ounces The last time such a proportion traded was Apr 25, the day of the 2011 top I called that top on Apr 24, 2011 here: peterlbrandt.com/how-do-you-spe… Not this time though???
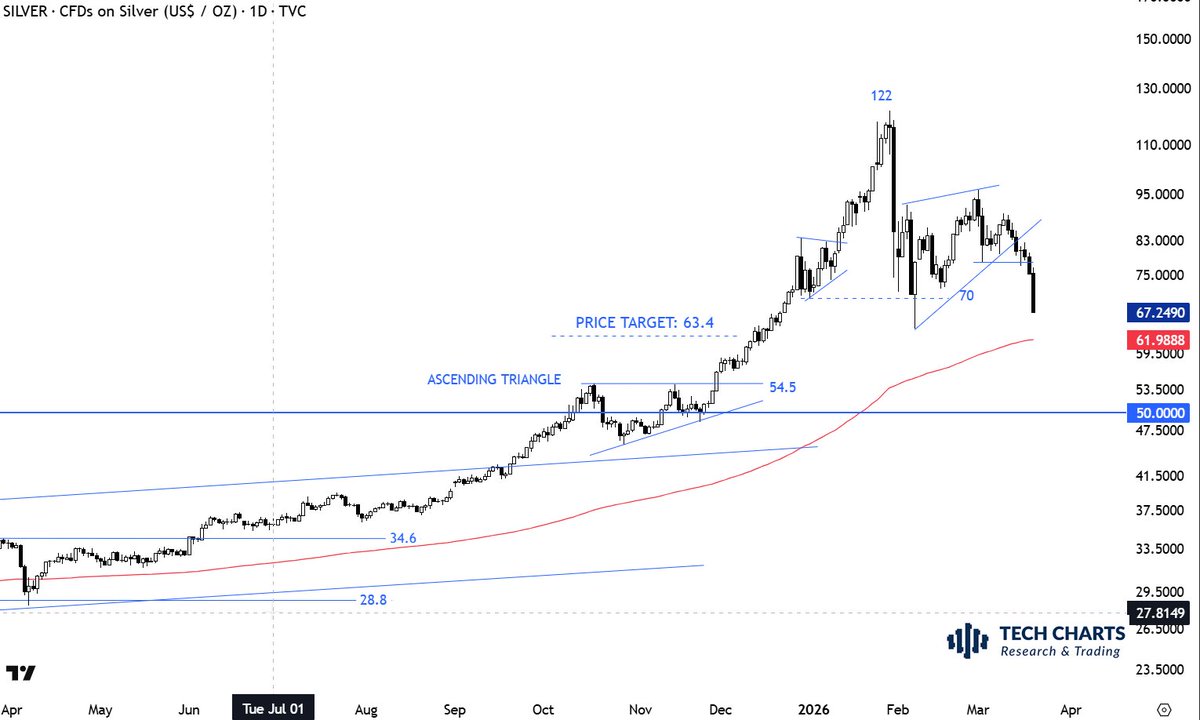
According to Bayesian Thinking: My prior on parabolic moves was that they can correct sharp and are not sustainable. There were predictions of 200+. World running out of Silver etc. None of them moved me as much as my selection of a tight ATR trailing. Following certain rules is very important for the peace of mind. Regret is very painful. You need make peace with your rules and guidelines. #SILVER


What's really exciting about this chart is the long-term view. Rectangle can act as a launching pattern for the larger scale ascending triangle. The 3 month-long rectangle is actually the tight consolidation right below the pattern boundary.
Gold weakness at a time of War is surprising many. Many who do not know the dynamics of liquidity. With its high price and liquidity is now a source of cash.
I'm not a political expert or have any education in this field. Looking from the side until now, it seems like there has been misjudgment on many fronts. Markets might be expecting more of that misjudgment in the near future.
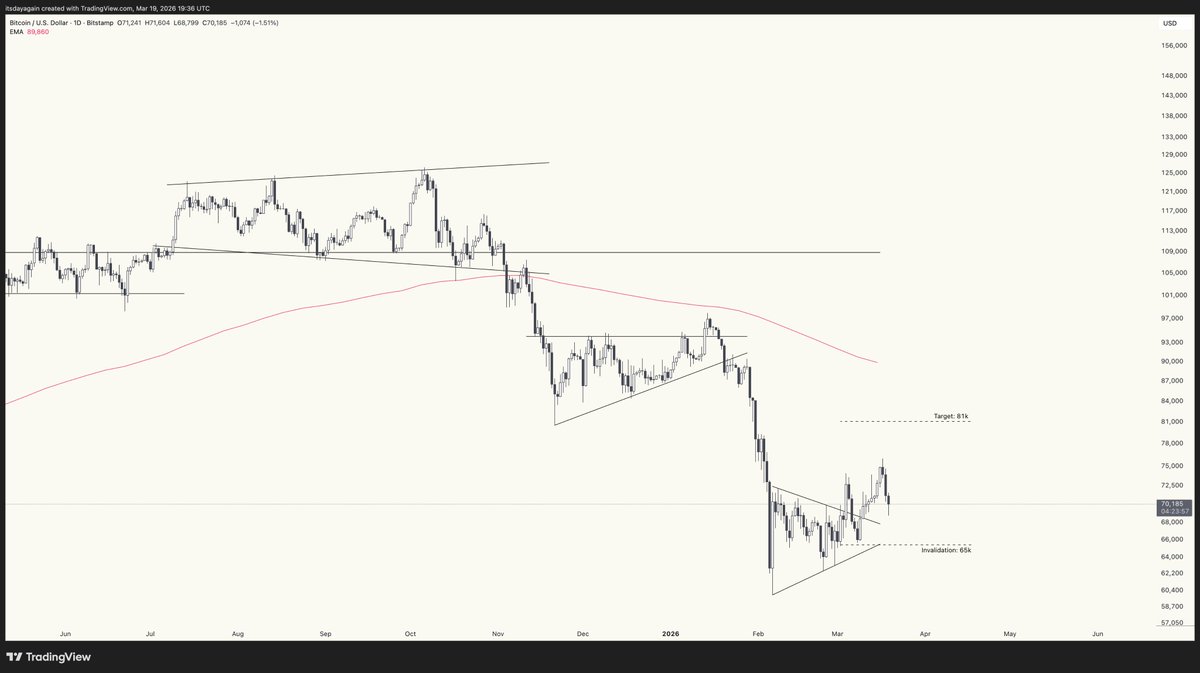
If you got in with a chart signal, you should get out with the chart signal. $BTCUSD

Pattern negation level reached. Sidelines... Equities have PPT (Plunge Protection Team) that steps in and frequently saves the market. If $BTCUSD doesn't have its own PPT, the weekly candle can get longer.