These are the current results for Boulder's first RCV election. These results are unofficial as they wait for more ballots to be counted.
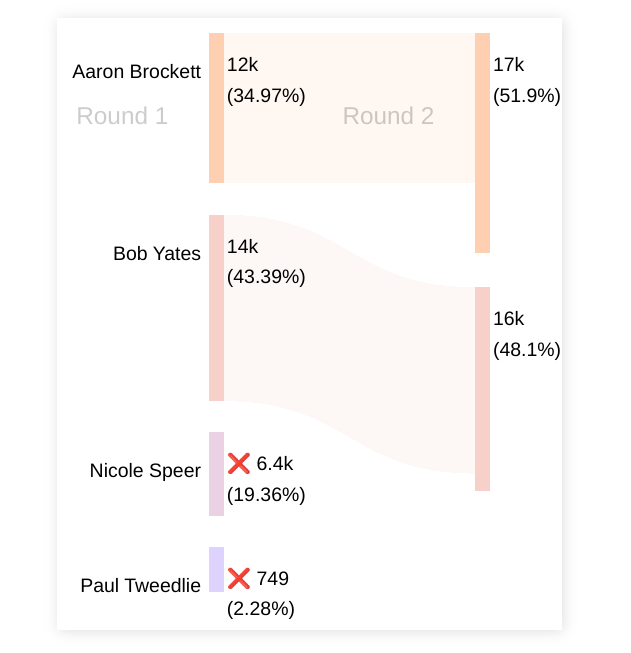
After two rounds, Bob Yates is currently in the lead. rcvis.com/v/city-of-boul…
@rcvisdotcom I now see a more obvious problem with the use of batch elimination: the Sankey diagram doesn't show any flow at all from the eliminated candidates. And the bar for Paul with only 2.28% is out-of-proportion. #sankey" target="_blank" rel="nofollow noopener">rcvis.com/v/city-of-boul…
@nealmcb This is caused by missing information in the data source (in this case, Dominion). There’s no reason batch elimination inherently wouldn’t show the transfers.
For example, you can see a Sankey here where batch elimination shows transfer data: #sankey" target="_blank" rel="nofollow noopener">rcvis.com/v/2023-ward-3-…
@nealmcb There is also a minimum height for each candidate in the sankey. Below a certain size, they are not proportional. We understand the concern and if it’s causing confusion, can look into explaining that on the page.
@rcvisdotcom Very helpful. I think it's very misleading to have a minimum size, especially with missing data like this. I tried to download the raw data for your example, but got "Login to create visualizations or download raw data". How is it different? Is this a known Dominion Issue?