Закреплённый твит

Catruffles (🐈⬛+🍄)
1.9K posts
@catruffles
Here to chart, trade, meow and share. 😺😼😸 Linear Reg. Channel, Supertrend, 9/21 EMA, Volume Profile, VWAP, Fibonacci Levels, RSI, Smart Money & More.
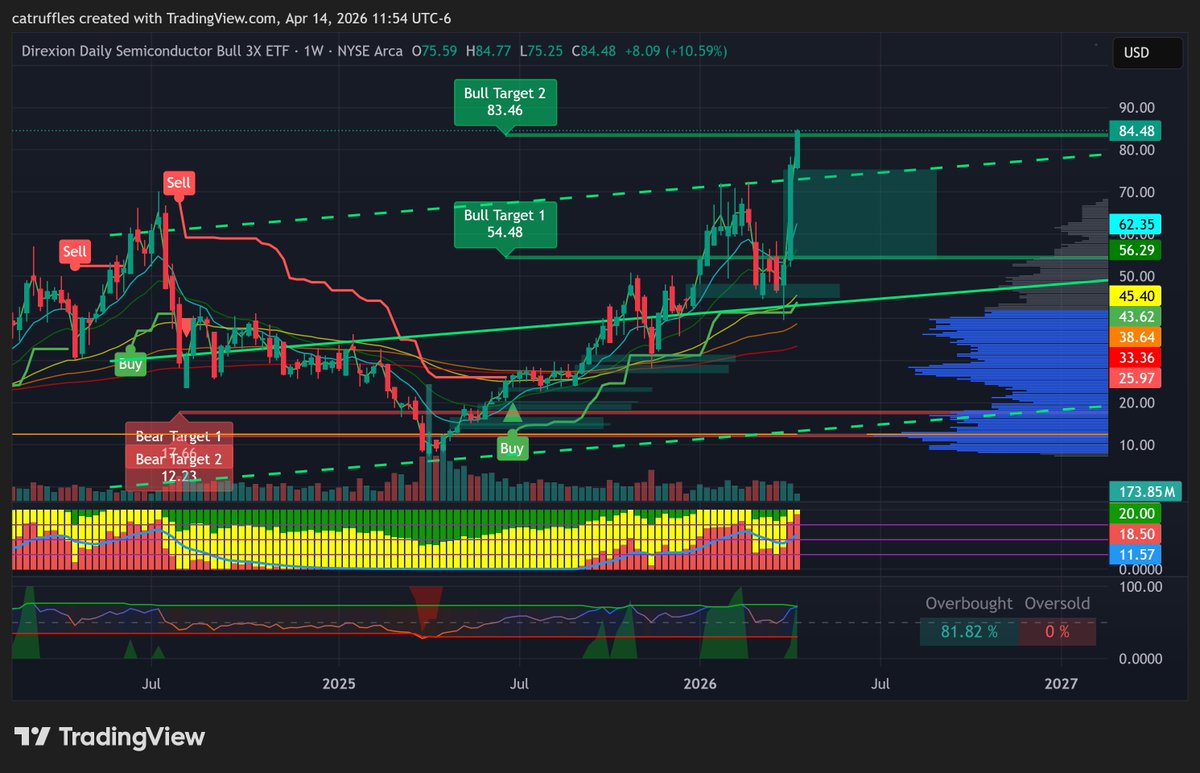
$SOXL Direction Daily Semiconductor Bull 3x Weekly Chart - Bullish Potential On track, first target almost hit! PT 1 - $54.48 PT 2 - $83.46 x.com/catruffles/sta…


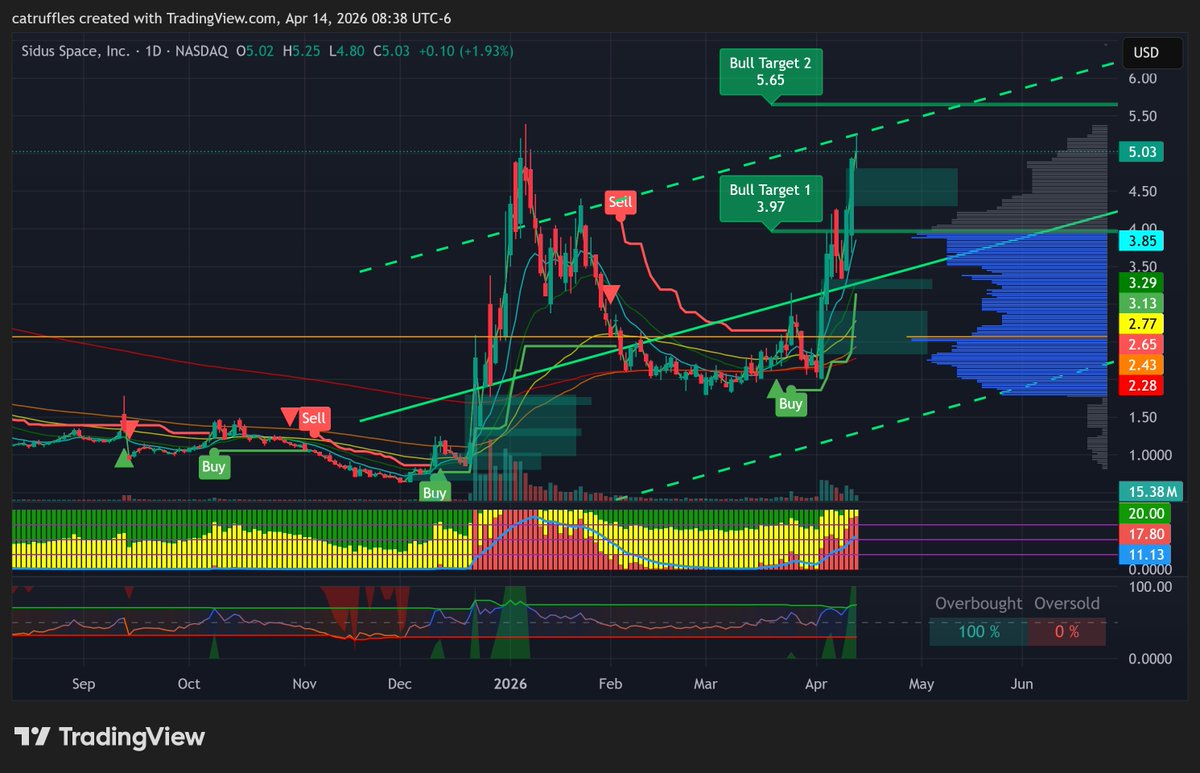
Added approx $1M USD of $SIDU.

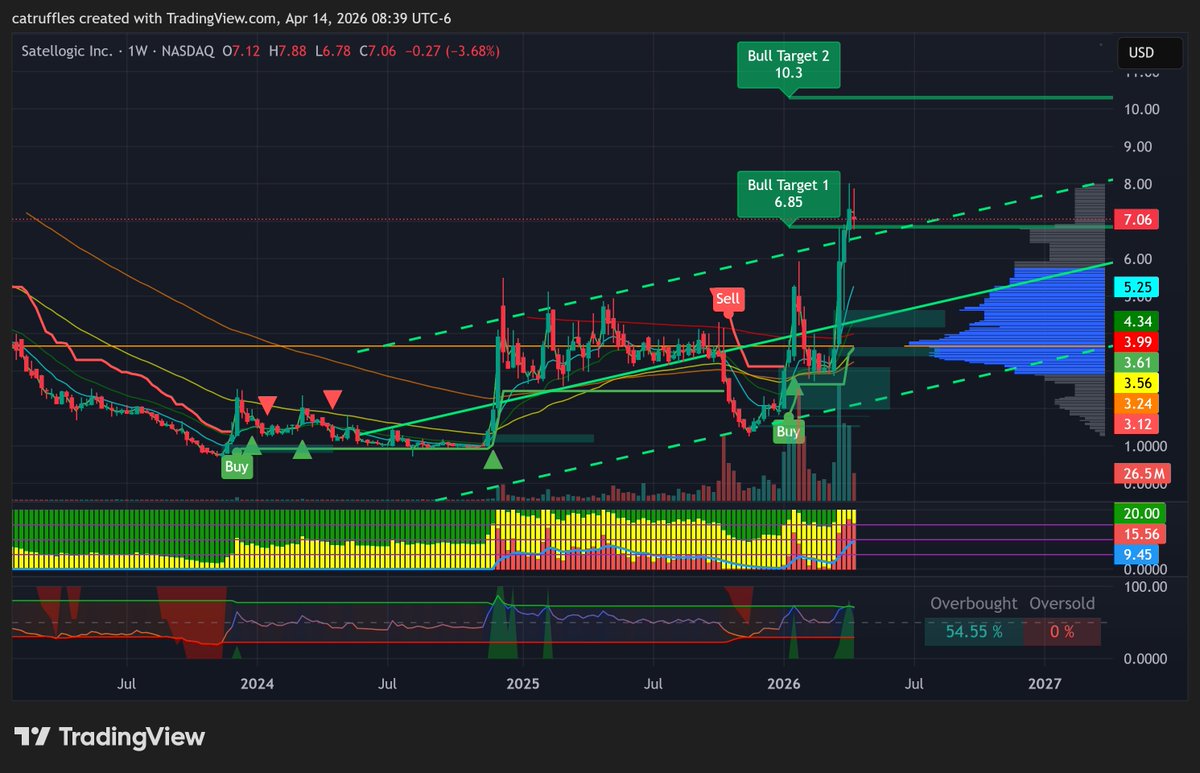
$SATL Satellogic Weekly Chart - Bullish Potential PT 1 - $6.85 PT 2 - $10.30

$NVO Novo Nordisk Weekly Chart - Bearish Don´t try to catch a falling knive, wait for support above key levels For a trend shift, needs to break the supertrend resistance at $62.22 so as the 0.382 and 0.5 ATH fibonacci levels PT 1 - $46.16 PT 2 - $35.61
@marketmike @chartismatic @market_sleuth Dear @market_sleuth and @marketmike, Inhave been following you both on X/Youtube for sometime and have deep respect for each of you. You both have valid points but are somehow wrong. Here’s my perspective consulted with @grok x.com/i/grok/share/1…


Indicators I use for meow)Charting and Technical Analysis on TradingView: - Linear Regression Channel - Fibonacci Retracement and Extensions - Volume - Volume Profile with Point of Control - VWAP with Bands - 9/21 EMA Bull & 21/9 EMA Bear Cross - Supertrend - 20/50/100/200 EMAs - Relative Strength Index Multi Length - MCDX (Smart Money) A thread: