In this first post, we'll cover the basics and build our very first dashboard together using the Iris dataset. Stay tuned for hands-on guides and tips to make your data visualization projects shine!
#DataScience#DataVisualization#DashPlotly#Python#TechTutorials
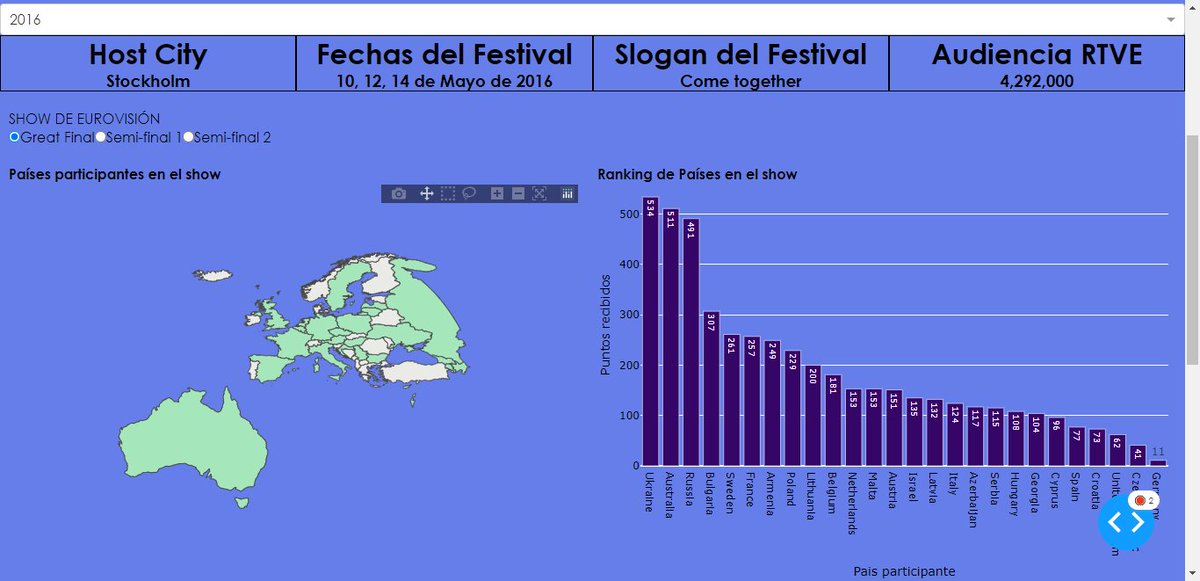
Pues a falta de unos cuantos retoques (me falta el año 2010, revisar el mapa, y poner el share de audiencia) el Dashboard con datos de Eurovisión va tomando forma!
#Eurovision#DashPlotly@CharmingData#Python
some day I will write a blog post about exporting #matplotlib contour plots as bitmap images, reconstructing scalar values from the RGB values and then plotting a scatter-grid on top of a background bitmap image in #dashplotly in order to add interactivity to better looking plots