Auto Racing Analytics

3.3K posts

Auto Racing Analytics banner
Auto Racing Analytics

Auto Racing Analytics

@AR_Analytics

Breaking down why drivers win races: speed, restarts, traffic management, clean driving Join: https://t.co/fJBnwVr6Bv 8️⃣
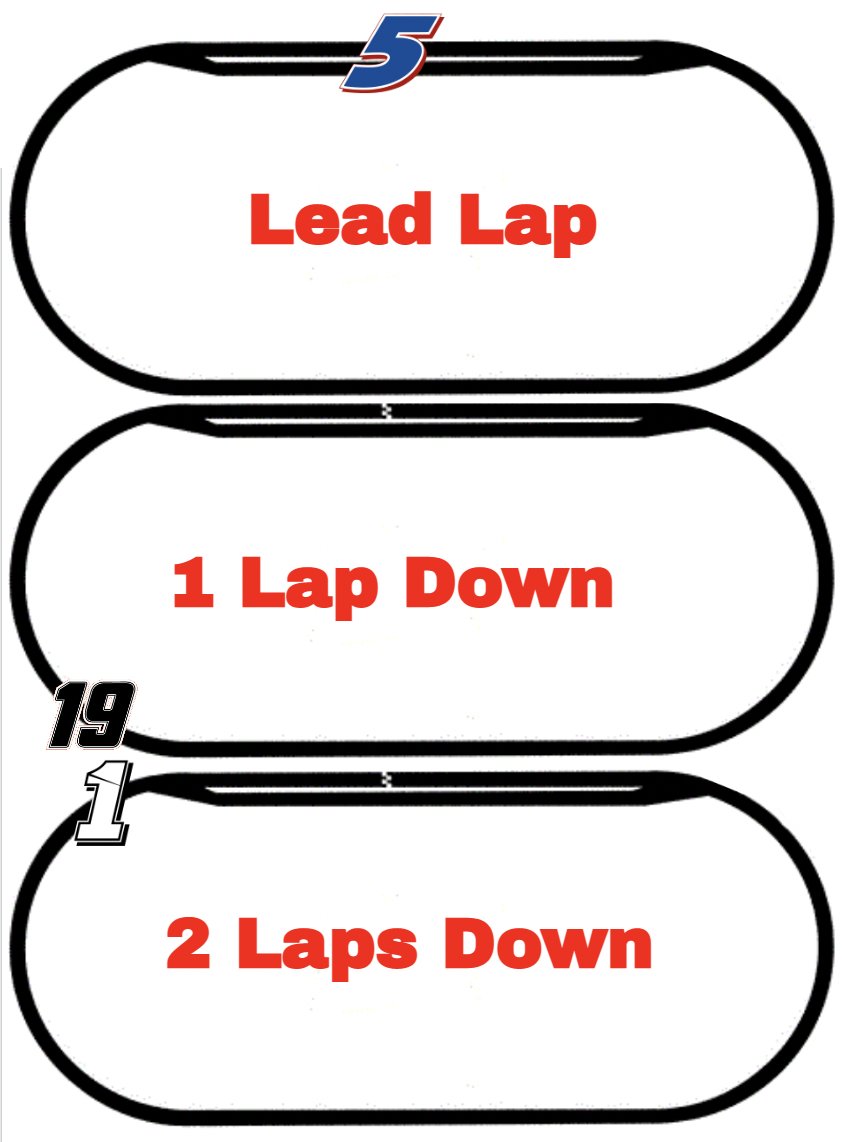
เข้าร่วม Mart 2022
95 กำลังติดตาม10.4K ผู้ติดตาม
ทวีตที่ปักหมุด
Auto Racing Analytics
Auto Racing Analytics@AR_Analytics·
Had the entire 267 laps at Miami gone green and the final positions were based on speed alone (Median Lap) Kyle Larson would've finished approximately 2.5 miles ahead of 2nd place
Auto Racing Analytics tweet media
English
42
152
1.6K
0
Auto Racing Analytics
Auto Racing Analytics@AR_Analytics·
Complete lists of where your favorite driver ranks last season (2026 coming after a few weeks of data are in!) for Optimal Lap Rank, Restarts, Passing, Defending and more is available for subscribers at AutoRacingAnalytics.com
English
0
0
2
1K
Auto Racing Analytics
Auto Racing Analytics@AR_Analytics·
Optimal Lap Model takes into account when drivers are in dirty air/clean air, tire degradation, and a driver's lap time inconsistency to estimate the expected best possible lap time of the car for each lap through a run.
English
1
0
4
1.2K
Auto Racing Analytics
Auto Racing Analytics@AR_Analytics·
Had the ENTIRE 200 laps in the O'Reilly race at Las Vegas been based on if each driver achieved the result of their Optimal Lap Model for every lap, this is approximately where the fastest cars would've finished on track
Auto Racing Analytics tweet media
English
3
1
85
5.6K
Auto Racing Analytics
Auto Racing Analytics@AR_Analytics·
Complete lists of where your favorite driver ranks last season (2026 coming after a few weeks of data are in!) for Optimal Lap Rank, Restarts, Passing, Defending and more is available for subscribers at AutoRacingAnalytics.com
English
0
0
6
2.2K
Auto Racing Analytics
Auto Racing Analytics@AR_Analytics·
Optimal Lap Model takes into account when drivers are in dirty air/clean air, tire degradation, and a driver's lap time inconsistency to estimate the expected best possible lap time of the car for each lap through a run.
English
1
0
8
2.4K
Auto Racing Analytics
Auto Racing Analytics@AR_Analytics·
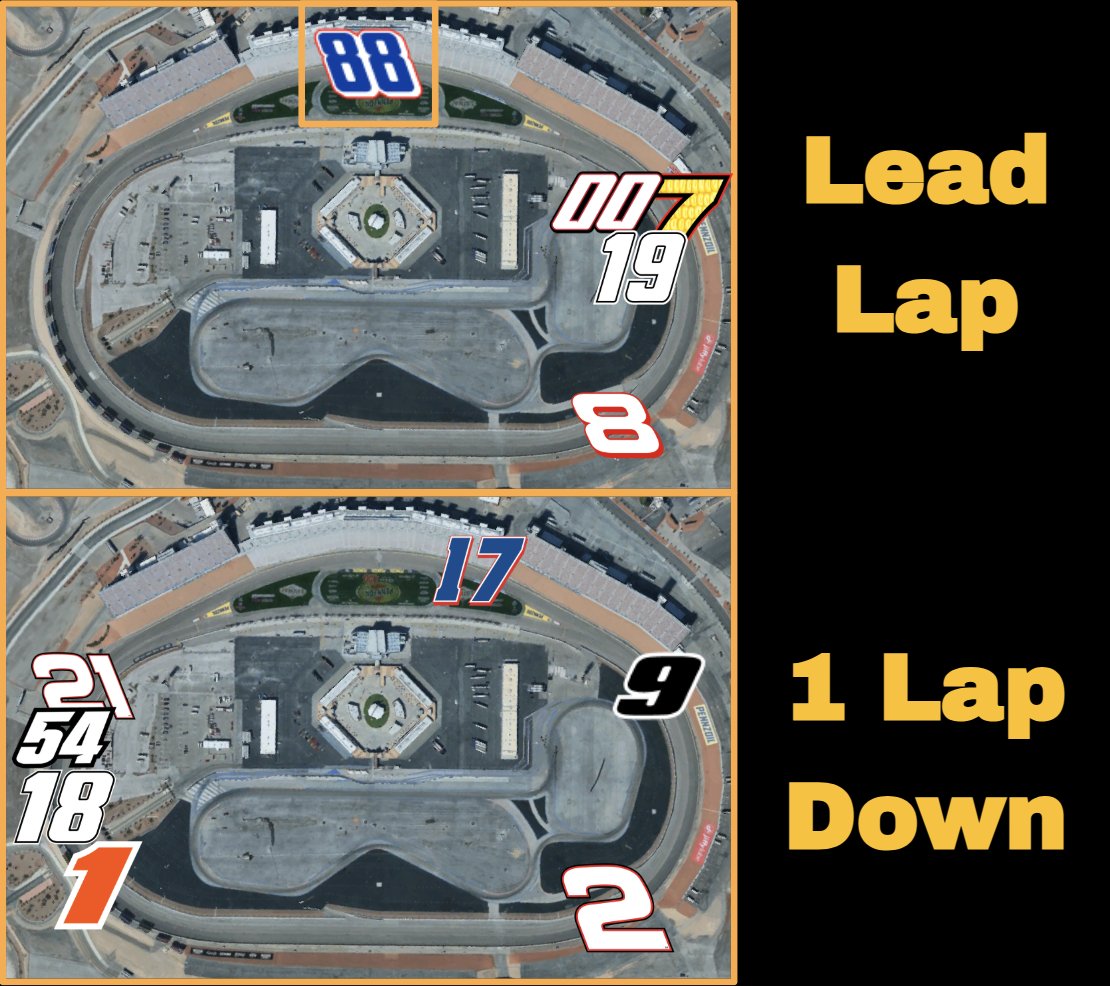
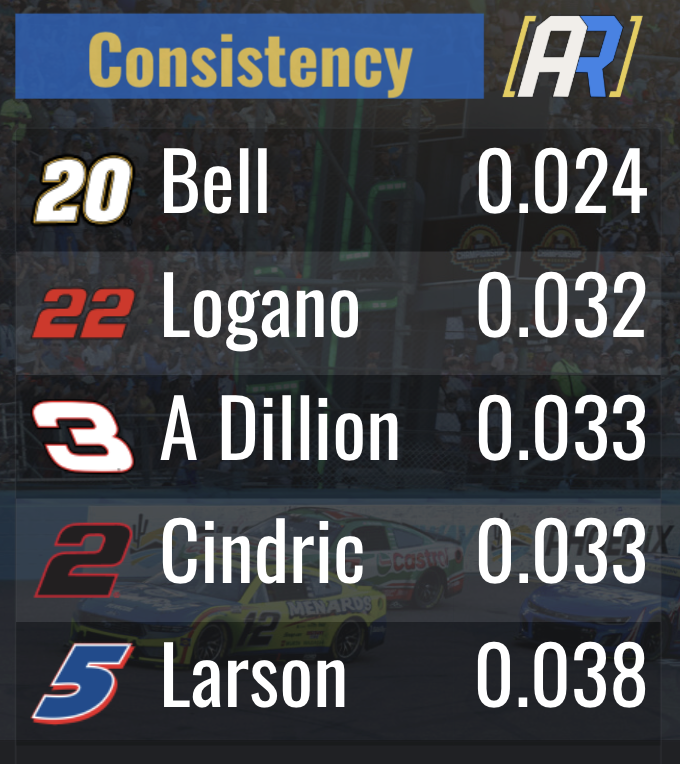
Had the ENTIRE 267 laps at Las Vegas been based on if each driver achieved the result of their Optimal Lap Model for every lap, this is approximately where the fastest cars would've finished on track Denny's got something figured out here
Auto Racing Analytics tweet media
English
7
22
366
34K
Auto Racing Analytics
Auto Racing Analytics@AR_Analytics·
Complete lists of where your favorite driver ranks last season (2026 coming after a few weeks of data are in!) for Optimal Lap Rank, Restarts, Passing, Defending and more is available for subscribers at AutoRacingAnalytics.com
English
0
0
1
1.2K
Auto Racing Analytics
Auto Racing Analytics@AR_Analytics·
Optimal Lap Model takes into account when drivers are in dirty air/clean air, tire degradation, and a driver's lap time inconsistency to estimate the expected best possible lap time of the car for each lap through a run.
English
1
0
1
1.3K
Auto Racing Analytics
Auto Racing Analytics@AR_Analytics·
Drivers to make the most consistent lap times in the 2026 Phoenix Spring Race This metric is just the average of how far off their optimal lap time a driver was when they were in clean air
Auto Racing Analytics tweet media
English
3
5
76
4.7K
Auto Racing Analytics
Auto Racing Analytics@AR_Analytics·
Complete lists of where your favorite driver ranks last season (2026 coming after a few weeks of data are in!) for Optimal Lap Rank, Restarts, Passing, Defending and more is available for subscribers at AutoRacingAnalytics.com
English
0
0
2
1.4K
Auto Racing Analytics
Auto Racing Analytics@AR_Analytics·
Best Restarters in the 2026 Phoenix Spring race How about SVG really figuring out this stock car thing? Positions Net is the total number of Positions gained and lost Retention Rate is % of restarts on which a driver maintained or improved their position
Auto Racing Analytics tweet media
English
6
20
270
10.4K
Auto Racing Analytics
Auto Racing Analytics@AR_Analytics·
Best Passers and Defenders in the 2026 Phoenix Spring race I wouldn't say this list is exactly full of surprises
Auto Racing Analytics tweet media
English
7
25
341
24.1K
Auto Racing Analytics
Auto Racing Analytics@AR_Analytics·
@Blaney made a race high 28 real green flag passes (not restarts, strategy, pit road, etc.)
English
5
7
67
2.8K
Auto Racing Analytics
Auto Racing Analytics@AR_Analytics·
Complete lists of where your favorite driver ranks last season (2026 coming after a few weeks of data are in!) for Optimal Lap Rank, Restarts, Passing, Defending and more is available for subscribers at AutoRacingAnalytics.com
English
0
0
1
1.3K
Auto Racing Analytics
Auto Racing Analytics@AR_Analytics·
Complete lists of where your favorite driver ranks last season (2026 coming after a few weeks of data are in!) for Optimal Lap Rank, Restarts, Passing, Defending and more is available for subscribers at AutoRacingAnalytics.com
English
0
0
5
2.7K
Auto Racing Analytics
Auto Racing Analytics@AR_Analytics·
Optimal Lap Model takes into account when drivers are in dirty air/clean air, tire degradation, and a driver's lap time inconsistency to estimate the expected best possible lap time of the car for each lap through a run.
English
1
0
9
2.8K
Auto Racing Analytics
Auto Racing Analytics@AR_Analytics·
Had the ENTIRE 200 laps in the O'Reilly race at Phoenix been based on if each driver achieved the result of their Optimal Lap Model for every lap, this is approximately where the fastest cars would've finished on track
Auto Racing Analytics tweet media
English
7
10
390
31.8K