ทวีตที่ปักหมุด

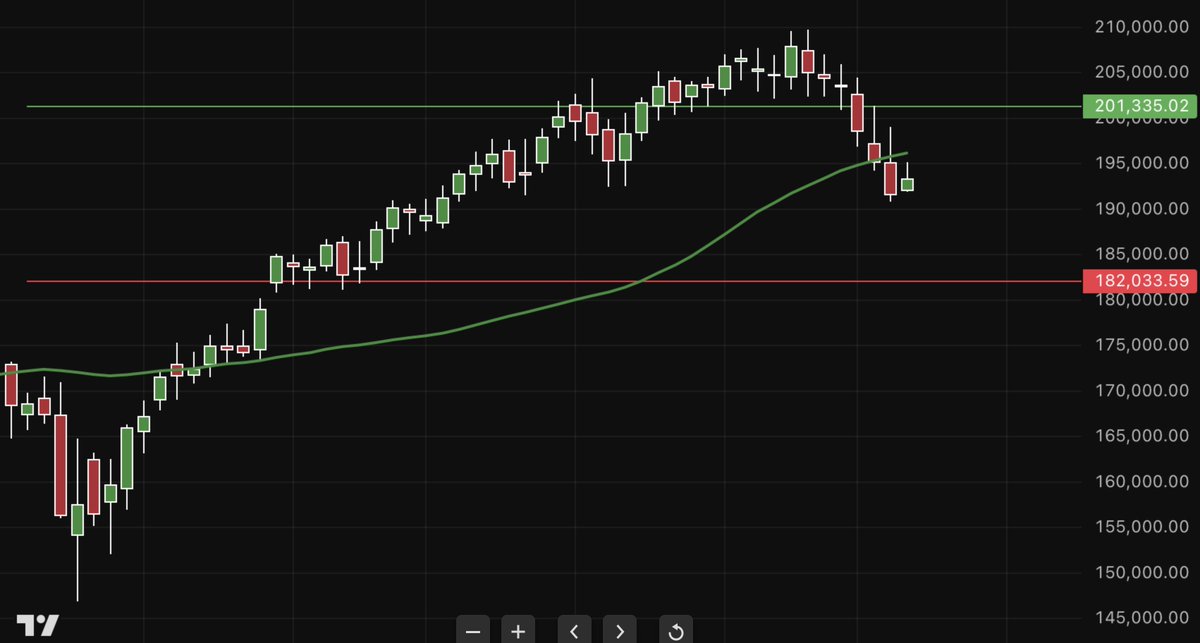
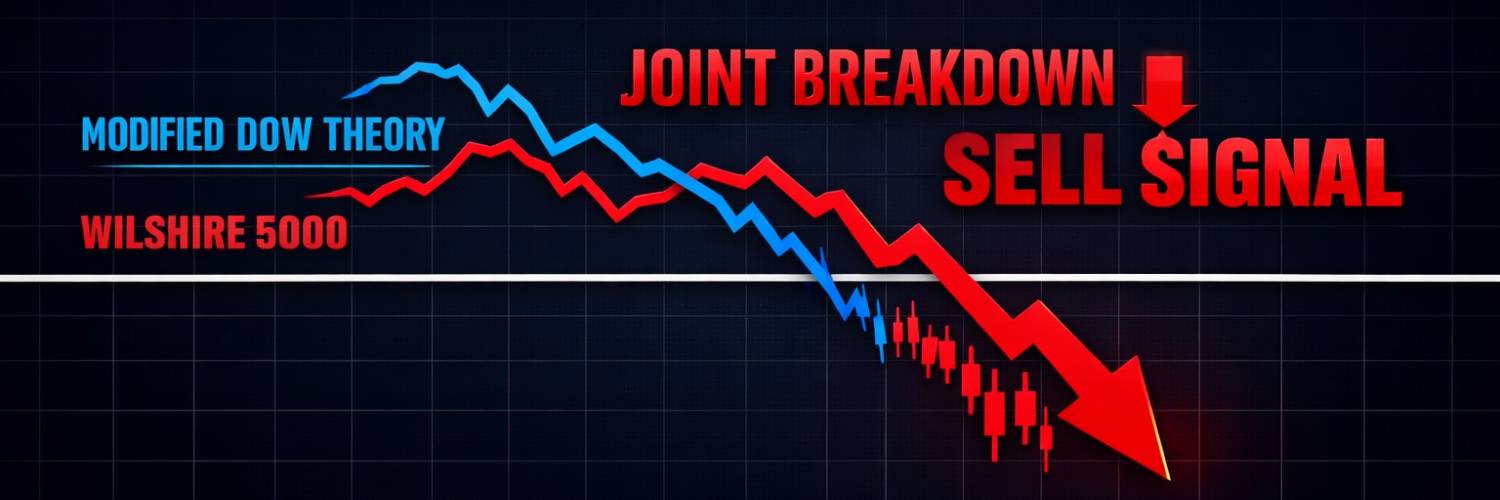
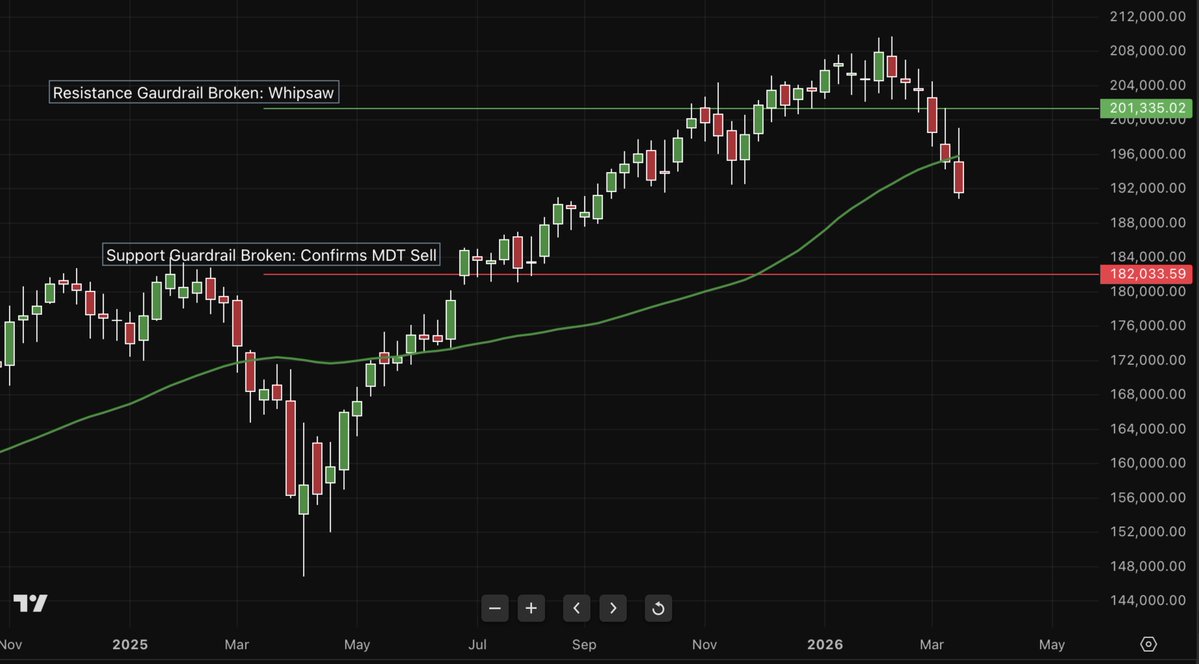
🚨🚨🚨MODIFIED DOW THEORY SELL SIGNAL ISSUED: Ending 3/20/2026, The Modified Dow Theory For US Equities Was -1.93% Below It's Sell Trigger, Signaling A New Primary Downtrend. The Dow Jones US Total Market Is -2.15% Confirming The Signal. Last Week It Was +0.23% & -0.03% respectively.
🚨I will now be analyzing the following markets: Dow, S&P 500, Nasdaq Indexes, Silver, Gold, Oil, US Dollar, Energy Infrastructure, Bitcoin and Ethereum.
Note: We had to replace the Wilshire 5000 with the Dow Jones US Total Market because charts stopped updating on the outlets used along with data not being downloadable.
While the confirmation index is essential, it has been replaced in the past several times when circumstances warranted. We just need to have some kind of broad index and there are several that can accomplish this. You can follow this using the ETF VTI or the symbol $DWCF.
The Domestic US MDT was -2.14% lower from last week.
By comparison, the International MDT which includes European and Asian Indicators is +1.05% above its sell trigger. Confirmation +0.57%. Last Week +3.51% and +2.91%.
Both indicators tend to follow each other as all markets are linked globally. Currently the Non US MDT has not signaled a sell. Watching this closely.
The US MDT now confirms that the primary trend has changed from up to down. When this happens, we place a support line 5% below the closing weekly candle and a resistance line 5% above it. Both of these are stationary. The purpose for this is to either confirm the downtrend when penetrated or a false signal if whipsawed through resistance. This has been plotted on the attached chart.
If support is broken we remove both lines. The downtrend is confirmed and we revert back to the original signal thesis for a new buy, which is when the MDT and the confirmation both reaffirm a new primary uptrend.
If the 5% resistance line is surpassed, then we call this a whipsaw and the signal was false and revert to the original line in the sand as well.
Purely mechanical.
That being said, those following the MDT now have a choice to make, either ride out the downtrend and hold all positions or sell and go to cash or a cash equivalent money market fund and wait it out. Over the decades both have worked, but those who wish more safety and a calmer stomach choose the cash method. The cash method allows compounding of gains previously made which in this case is about 12% from the last buy to the current sell, more if you were in better performing stocks, funds and ETF's, and not just index ETF's.
Riding it out makes sure that when the bottom is hit you're in for the next run. Overall, the market returns about 8%-10% over the long term with just buy and hold.
Taxable accounts also have to take into consideration capital gains while non taxable accounts like IRA's do not.
The MDT has returned between 18-20% long term, sometimes much better and sometimes, like this round, less but you have to look at the compounding effect as well when it returns 25, 30% or more from trough to peak.
The MDT doesn't care about the high or the low. It just wants to capture the solid middle move and do that consistently. That's why when you look at the long haul, an “average gain over a 5 year period” reaches 18-20%.
Average buy signals last from 2.5 to 5 years. Average sell is 6-9 months. These are averages and there are outliers. This signal, being approximately 1 year for the buy, would be considered on the low side.
The shortest I've seen for a sell signal was 6 weeks, also unusual. That was a classic whipsaw.
For now, I will keep the commentary to a minimum. I will be giving shorter term momentum analysis in each weekly report for the sectors I've already mentioned. The math is more important. The noise and the news is not.
Dow Analysis:
Short-term outlook (daily/weekly): Bearish. The Dow has dropped sharply 10% in just 5 weeks from its February high, remains below momentum, and sits in a bearish immediate/short-term trend with overhead resistance near 46495.
Medium-term outlook (monthly/quarterly): Cautiously negative and turning. After 28 months of bullish monthly signals, the market has broken below the prior month’s low and closed beneath the key Monthly Support at 45729; a turning point is due this month but caution is required for potential further decline.
Long-term outlook (yearly+): Still bullish overall but vulnerable. The secular bull market since 2009 and broadest trends remain intact, yet 2026 is a major cyclical timing year with the index already down 5.17% YTD and below last year’s close, raising the risk of a correction into 2027 unless new highs are reclaimed.
S&P 500 Analysis:
Short-term outlook (daily/weekly): Bearish. The S&P 500 has fallen 6.9% in just 3 weeks from its late February high, sits below momentum with all immediate/short and intermediate term weekly signals bearish, and faces immediate overhead resistance at 6674.
Medium-term outlook (monthly/quarterly): Cautiously negative and turning. After only a 2 month decline so far, the index has already broken beneath the prior month’s low; continued weakness or a close below the key Monthly Support at 6360 would confirm a temporary high and risk further correction into the June 2026 cyclical turning point.
Long-term outlook (yearly+): Still strongly bullish but at a critical juncture. The 16-year secular bull market (941% gain) and broadest trends remain intact with four Major Bullish Support Areas plotted; a close back above last year’s high would extend the rally into 2030, but staying below the 2025 close at 6845 keeps a corrective phase into 2030 on the table.
Nasdaq Analysis:
Short-term outlook (daily/weekly): Bearish. Nasdaq Composite has fallen sharply over the past 2 months, breaking below the prior month’s low and trading beneath both daily and weekly trading envelopes with bearish stochastic momentum on these levels. Immediate overhead resistance starts in the 21870–22130 zone (daily pivots), with next near term turning points March 24 and April 27.
Medium-term outlook (monthly/quarterly): Cautiously negative and turning. After only 2 months of decline, the index has already broken beneath the prior month’s low and the short term monthly stochastic has turned bearish. A close below the key Monthly Support at 22193 would confirm further weakness into the April turning point and possible August Danger Zone.
Long-term outlook (yearly+): Still bullish overall but currently in a corrective phase. The secular bull market since 2009 remains intact on weekly to yearly timeframes, yet 2026 has started with a 6.85% YTD decline. The July 1, 2026 Seasonal And Cyclical time frame will be important; holding above broader yearly support keeps the path open for new highs into the 2030s.
Metals:
Silver: 10 Week Moving Average: We are now -19.66% below the sell trigger, confirmed by The Dow Jones Precious Metals index below it's confirmation. (see below) Last Week. -5.77.
20 Week Moving Average is -7.59, last week +11.32% and 40 Week Moving Average +17.80, last week +42.00%.
Silver Analysis:
Short-term outlook (daily/weekly): Bearish. Silver has weakened sharply in recent weeks, penetrating and closing below the prior week’s low with all immediate and short-term weekly indicators now bearish. Daily position remains bearish with overhead resistance beginning at 74.37.
Medium-term outlook (monthly/quarterly): Cautiously negative and turning. After two months of weakness and a bearish reactionary move on the monthly level, silver is trading below last month’s close despite an earlier new intraday high this quarter. The next Seasonal and Cyclical turn is due in April (potential temporary local high); a close beneath the key Monthly Bearish Reversal at 45.50 would confirm deeper correction risk.
Long-term outlook (yearly+): Still bullish overall but vulnerable. The secular bull market since 2020 (610% gain) remains intact with four Bullish Support Zones including positive weekly to yearly signals. However, silver is down 1.32% YTD and below last year’s close and yearly pivot point, making the July 2026 Seasonal Time Frame and 2027 cyclical turning point critical for whether the uptrend extends or corrects.
Gold: 10 Week Moving Average -9.26 below it's sell trigger. Last Week +1.38%.
20 Week Moving Average -2.40, last week +9.66. 40 Week Moving Average +9.65, last week +23.34.
Gold Analysis:
Short-term outlook (daily/weekly): Bearish. Gold has weakened notably in recent weeks, closing sharply lower and beneath the prior week’s low with bearish momentum across daily and weekly models. Immediate overhead resistance begins at 4900.
Medium-term outlook (monthly/quarterly): Cautiously negative and turning. The market is in a bearish reactionary phase on the monthly level after two months of weakness and trading below last month’s close of 5247.90, despite an intraday high this month. Continued closes beneath monthly support would signal risk of a deeper pullback.
Long-term outlook (yearly+): Bullish overall. Gold remains in a strong secular bull market since 2015 (11 years) with positive weekly to yearly signals and is up 5.38% YTD. The next major test comes at the July 1, 2026 Cyclical and Seasonal turning point; holding above critical support near 3841 keeps the long-term uptrend intact.
DJ Precious Metals (DJGSP) Confirmation (10 Week): This week -18.91 below it's sell trigger. Last Week -6.40%. This confirms a sell signal for silver with gold.
20 Week Moving Average -10.85, last week +4.71. 40 Week Moving Average +5.55, last week +24.36.
Dollar Analysis:
Short-term outlook (daily/weekly): Moderately bullish. The US Dollar Index reached a new high at 100.54 in early March and remains supported by bullish weekly momentum, trend, long-term trend, and cyclical strength, despite a modest recent 1.56% pullback. Daily signals are moderately bullish, trading near overhead resistance at 99.683 with support at 99.586.
Medium-term outlook (monthly/quarterly): Cautiously positive but unconfirmed. Only a 1-month reaction rally has developed from the January low with a new monthly high printed. A monthly close above 98.078 would strengthen the uptrend, while a close below 96.494 would warn of weakness and potential retest of support.
Long-term outlook (yearly+): Mixed/corrective within a broader bearish cycle. The dollar has been in a downtrend since the 2022 peak but elected a bullish yearly reversal at the 2025 low. Weekly to yearly signals remain positive for now, though momentum divergence exists. The July 1, 2026 Seasonal and Cyclical target will be a key inflection point.
Oil Analysis:
Short-term outlook (daily/weekly): Moderately bullish to neutral. NY Crude Oil pulled back sharply by 23.45% in one week from the March 9 high at 119.48 (reaching 91.45), yet daily signals remain moderately bullish with support beginning near 97.65 and weekly momentum, trend, long-term trend, and cyclical strength all stay positive.
Medium-term outlook (monthly/quarterly): Cautiously bullish but unconfirmed. The move is still only a 2-month, 22% reaction rally from the December 2025 low with new highs above 78.40. A monthly close above 67.83 would confirm continued upside; below 61.12 would signal lost momentum and likely retest of support.
Long-term outlook (yearly+): Mixed/structurally cautious. Oil remains in a protracted bearish consolidation since the 2008 peak, with a bearish yearly reversal elected at the 2025 close, yet weekly to yearly signals are positive after holding the 2025 major low (critical support at 55.00). The July 1, 2026 Seasonal and Cyclical turning point will be the next major test.
Energy Infrastructure Analysis (using Alerian MLP ETF):
Short-term outlook (daily/weekly): Bullish. The Alerian MLP ETF closed at 52.86 after a modest daily pullback of -0.38% (but +1.24% for the week), with all indicating ranges (momentum, trend, long-term trend, and cyclical strength) fully bullish on both daily and weekly levels amid a “Local High” and confirming new pattern forming.
Medium-term outlook (monthly/quarterly): Strongly bullish. February closed up +4.02% at 52.04, and both monthly and quarterly signals say it's moving higher with every indicating range bullish.
Long-term outlook (yearly+): Bullish. Consistent bullish momentum, trend, long-term trend, and cyclical strength across daily, weekly, and monthly timeframes confirm the broader uptrend in energy infrastructure and MLPs remains firmly intact however yearly data is limited.
Bitcoin Analysis:
Short-term outlook (daily/weekly): Mixed with bearish daily bias. Bitcoin closed near $70497 after a modest +0.83% daily gain, but momentum and trend remain bearish on the daily level. Weekly momentum has turned bullish while a new pattern is forming, with signals indicating a temporary low is currently holding for now.
Medium-term outlook (monthly/quarterly): Bearish and corrective. February delivered a sharp -14.85% decline with monthly momentum and trend both bearish. The quarterly view shows the market “pressing lower” despite the recent knee jerk high close.
Long-term outlook (yearly+): Structurally bullish. Despite the pullback, cyclical strength remains positive on yearly timeframes. The secular bull market remains intact overall, though weekly long term trend has turned bearish, suggesting the current move is a correction within the larger cycle.
Ethereum Analysis:
Short-term outlook (daily/weekly): Mixed with signs of a reaction rally. Ethereum closed at 2145.89, up +0.37% daily and +2.54% for the week. Daily momentum remains bearish with a neutral trend, and weekly momentum and trend have turned neutral amid a “Reaction Rally,” while daily cyclical strength stays bullish.
Medium-term outlook (monthly/quarterly): Bearish. February delivered a heavy -19.79% drop with a close at 1964.71 with all monthly indicating ranges flashing bearish. Quarterly signals continue to show “Possible Lowest Closing Still Bearish,” keeping the corrective tone intact.
Long-term outlook (yearly+): Cautiously mixed but under pressure. Daily long-term trend and cyclical strength remain bullish, yet weekly and monthly longer-term signals are clearly bearish, indicating the current move is part of a broader corrective phase within the larger bullish cycle.
Disclaimer: This commentary is for informational and educational purposes only and reflects general market observations and historical patterns. It is not investment advice, a recommendation to buy or sell securities, or a guarantee of future results. Markets involve risk, and past performance does not predict future outcomes.
Peace, Love, Espresso. ☮️💕☕️
May we all grow exponentially. 📈
The Cap 🫡
English