ทวีตที่ปักหมุด

Jung3984🇻🇦🥷
3.5K posts

@Human4893
🥷💎💍🪙👑🧌 #베이직단 #황금고블린 #황금의시대 #AIPSYCHOSISPSYCHOSISPSYCHOSIS #GOLDENAGE


normalize realizing that the whole cheat code to life is being insanely delusional and optimistic


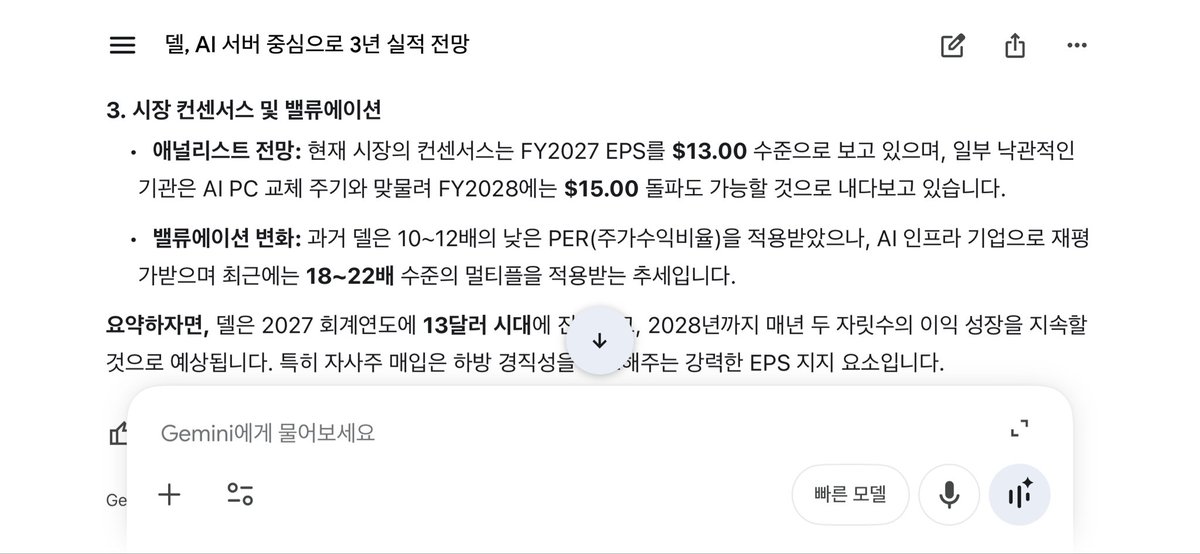
Trump said “Go out and buy a Dell!” — and the stock surged. But the market wasn’t buying more XPS laptops. It was buying $Dell’s explosive AI GPU server growth. $25B+ AI servers in FY2026 → $50B guidance in FY2027 $43B backlog SMCI tailwind + Buy American momentum 📈 Consumer Dell is old news. This is the new AI Infrastructure Dell. 🚀 Full analysis here 👇

THE BIGGEST MISTAKES OF RETAIL TRADERS ▫️Bayesian thinking Amateurs believe a trader should act like a politician: taking a stance and sticking to it through thick and thin. If they change their mind, it is viewed as "embarrassing" in the eyes of the crowd. Professionals, however, are always Bayesian thinkers. If the facts, the charts, or the economic data change, you must also change your position immediately, rationally, and without emotion. You either learn and accept this, or you are going to crash and burn very badly. Financial markets—much like the weather—are non-linear, chaotic systems where the "butterfly effect" prevails. The market is a dynamic, constantly evolving open system where new information and external forces flow in minute by minute. Some argue that the market is fractal. But this is not entirely true; it only appears to be fractal. On minute and second charts, the vast majority of price action is driven not by fundamental changes in value, but by liquidity hunting, the skirmishes of high-frequency trading algorithms, and order book dynamics. Therefore, the signal-to-noise ratio is at its absolute worst on very low timeframes. This is why so-called "Cognitive Flexibility" (based on Professor Tetlock's work) is indispensable. Trading is not chess, where we can see all the pieces on the board; it is poker. As the cards are dealt (as new data arrives), probabilities must be constantly recalculated. We weigh the odds: "What cards do the others hold? Should I fold my hand before the weekend, or stay in the game?" The analogy of blackjack and card counting also applies: we only place large bets when the deck favors us (this is called a "hot deck"); otherwise, we minimize our risk. This game is simply not for those who cannot tolerate uncertainty. This is exactly why a high win rate (strike rate) is not important at all. A trader can have a win rate of merely 15% and still make a fortune. How? By keeping their losses as tiny, insignificant "tests" (just "dipping their toes in the water" to gather information), but when they catch a massive trend within that 15%, they make a killing. A counterexample is Al Brooks, who scalps tiny price movements with 20 trades a day. He has an exceptionally high win rate, but his return per trade is very small. This is the hardest concept for retail traders to grasp, because intuitively, the untrained mind fundamentally assumes a symmetrical Gaussian distribution. Market returns, however, follow power-law and fat-tailed distributions (see the research of Mandelbrot and Taleb). This means that the overwhelming majority of market returns are generated by a few rare, extreme-magnitude moves. The most successful trend-following funds (CTAs), for instance, deliberately operate with low (30-40%) win rates, but they strictly cut their losses and let their portfolio-saving, massive winners run. This is called positive asymmetry. This is what I constantly emphasize to my followers as well, providing calculation methods for it. (Incidentally, this is also a central issue in machine learning, known as the Multi-Armed Bandit problem). The large institutional players trade by mapping out market possibilities and probabilities (how many paths lead to each outcome, thereby allowing those options to be weighted), as well as identifying the precursors to each outcome (which levels will confirm or invalidate the fulfillment of a scenario). They then execute micro-trades if they see momentum shifting toward one outcome or another. If they lose, they lose a little. But if the bet pays off, they scale up the position. Size up the winner, cut the loser. To this approach, I can also attach expected dynamics using speed profile and vanna profile analysis, since options positioning data is essentially a simultaneous bet on both the spot price and volatility. Therefore, you must let go of the ego-driven need to "always be right." In a random system, you cannot truly be right, because it does not operate by the strict rules of logic. On the very rare occasions it does, it usually stems from the interpretation of external information. Thus, you are neither right nor wrong in the market; you simply either catch the move or you don't. The other crucial point is that you must trade the distribution, not your fantasy. The market is not a deterministic system, despite how much many people seek and desire it to be. Do not look for certainty in a stochastic system. The only thing that will keep you afloat is a well-planned, rational, and consistent systematic approach backed by self-discipline. An analyst's job, competence, and quality typically boil down to how accurately they map out these possibilities, dynamics, and probabilities. But since we operate in a randomized, non-symmetrical system with an ever-changing distribution, an analyst's performance will inherently fluctuate as well. Based on my own backtests, my expected dynamics and level-bound dynamics were accurate 58-62% of the time, while my geopolitical forecasts hit a 73% accuracy rate... SOME PRACTICAL TIPS ▫️Using the Volume Profile is crucial. Price is always king. Volume is a secondary, supplementary tool that, by itself, never provides a buy or sell signal. Its sole purpose is to confirm (or question) the price action by placing it into context. I always emphasize the importance of the first 20-30 minutes. If the volume in the first half-hour is exceptionally high, it signals a trend day. In this scenario, the market gets a green light: institutions are present, breakouts can be traded confidently, and there is a high probability that the price will close near the extremes of the daily range (in the bottom/top 10-15%). Conversely, if volume is low, the market will only chop sideways and be driven by daily options flows (gamma profile). During these times, most breakouts will be fakeouts, and the focus should shift to trading inward from the edges of the range—i.e., mean reversion trading. This is further confirmed by checking the type of iron fly profile the market adopts, short or long. One is a bet on momentum, while the other is a bet on ranging. When the price breaks through a clear support or resistance level (confirmed by at least two prior touches), volume must spike dramatically. The real trick is that the first minor pullback following the breakout must occur on very low volume, and the price must not retrace below 62% of the breakout candle. This is the perfect trend-continuation entry. Once a trend is successfully caught, I usually trail my stop-loss order just below the low of the last high-volume candle (in the case of a long position). The logic is that this is where the large institutions stepped in; if they allow the price to drop below this level, the "big boys" are no longer defending the market, meaning I have no business being there either. If a massive volume spike suddenly appears at the very end of a long, extended trend, far away from support levels, it is a sign of exhaustion. It represents the FOMO panic of latecomer amateurs and a few artificially induced capitulations. This is not an entry signal; it is the absolute best exit point. If you were in the trade up to this point, this is where you lock in profits, because it is almost always followed by a violent snapback (reversal). Similarly, if volume diverges while the price is testing resistance, it indicates exhaustion, which can also be confirmed with RSI and MACD, as they trigger algorithmic reactions. If the market tests a level (even after a drop) and suddenly reverses with extreme volume in the opposite direction, it signals that the dynamics of the previous trend have been invalidated. Daily VWMA, VWAP, and AVWAP levels are incredibly important, as are the Initial Balance and Value Area levels on a TPO chart. Here, according to Steidlmayer, when price opens outside the previous day's Value Area and then re-enters and is accepted (spending 2+ TPO periods inside the VA) back inside, there is an 80% statistical probability that price will travel to the opposite side of the Value Area. In my own analysis, I always examine what dynamics and realized volatility expectations traders are assigning to specific zones via the options market. Deviations from these expectations, or the actualization of the anticipated dynamics, provide a massive informational edge and help map out the distribution much more accurately, thus reducing the number of micro-trades required. Anyone who followed my live intraday momentum signals last year and the year before knows exactly what I am talking about. An additional pro tip: it is highly recommended to apply a very slow 150-200 period Bollinger Band directly to the volume bars, plotting the 3, 3.5, 4, 4.5, and 5 SD levels. Personally, I also like to adjust the SD levels using the Cornish-Fisher expansion based on the skewness of the volume's own distribution, a technique I demonstrated in my educational post on mean reversion trading. (This is because Standard Deviation is inherently based on a Gaussian distribution). This helps immensely in judging whether a volume move is genuinely statistically significant or not. One more advanced trick: I monitor the standard deviation of the deviations from the volume's moving average. This is even more precise, because here I am comparing the magnitude of the deviations from the mean. A specific volume spike might look high to the naked eye, or even in terms of simple standard deviation, but it might not actually be statistically unusual. I consider services like order book depth, footprint charts, market delta, etc., to be completely useless, as the overwhelming majority of market volume is executed by algorithms. Large funds operate using "Iceberg" orders and VWAP time-slicing. They intentionally mask their true intentions in the order book, meaning you will always just be chasing micro-noise. Furthermore, it provides absolutely no actionable forward-looking edge. The only thing that is truly predictive is options positioning, but even there, I don't care about the daily intraday noise; I am solely interested in the pre-open data. That data reveals true market sentiment—i.e., what traders actually think about the underlying market structure. @OptionsDepth The rest is just smoke and mirrors and pseudo-intellectual overcomplication.