StatSharp

3.8K posts

StatSharp banner
StatSharp

StatSharp

@StatSharp

Advanced sports betting insights and statistical analytics - #ratings, #systems, #simulations, #trends, #bettingtips.

Milwaukee, WI เข้าร่วม Haziran 2009
905 กำลังติดตาม779 ผู้ติดตาม
ทวีตที่ปักหมุด
StatSharp
StatSharp@StatSharp·
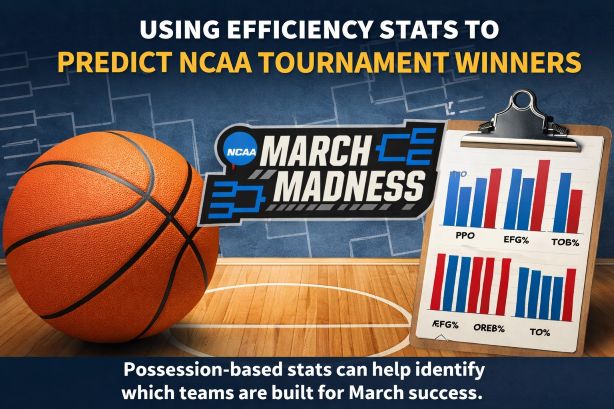
🏀Leveraging Efficiency Stats to Predict NCAA Tournament Success Every March, most bettors and fans get pulled toward the obvious storylines. Seed lines, conference reputation, recent momentum, and brand-name programs usually dominate the conversation. Those things matter, but they are not always the best indicators of who is actually built to win in the NCAA tournament. The tournament is won one possession at a time. That is why possession-based efficiency stats remain one of the sharpest tools for identifying teams that are truly equipped for March success. statsharp.com/joomla/index.p…
StatSharp tweet media
English
1
1
1
101
StatSharp
StatSharp@StatSharp·
🏀Danny Hurley’s March Machine When Danny Hurley brings a highly seeded Connecticut team into the NCAA Tournament, the Huskies have looked less like a contender and more like a machine. Read more about Hurley's March ATS dominance 👉 newsletters.statsharp.com/posts/opening-…
StatSharp tweet media
English
0
1
2
24
StatSharp
StatSharp@StatSharp·
Iowa’s Trouble vs. Quality Competition Iowa’s recent track record suggests the Hawkeyes have struggled badly when the competition level rises. Since the start of the 2025 season, Iowa is just 2-12 ATS when facing good teams with winning percentages between 60% and 80% after the 15-game mark, a telling sign that this team has consistently failed to meet market expectations in tougher matchups. With an average scoring margin of 74.5 to 81.1 in those games, the pattern points to more than just bad betting luck—it suggests Iowa has had real difficulty matching the execution, toughness, and consistency of stronger opponents, which is exactly the kind of red flag bettors should pay attention to in a tournament setting. #MarchMadness
English
0
1
1
146
StatSharp
StatSharp@StatSharp·
🏀Gaels - Brake Pedal for High-Octane Offenses When Saint Mary’s faces explosive offensive teams, the Gaels have consistently dragged those games into their own world—slow, methodical, and far lower scoring than the market expects. Get more details on how this has affected the over/under market in SMC games 👉 newsletters.statsharp.com/posts/opening-…
English
0
0
2
59
StatSharp
StatSharp@StatSharp·
Michigan’s Costly ATS Slumps Michigan has shown a clear and costly pattern when it comes to failing to cover the spread—once the Wolverines start missing expectations, it tends to snowball. Since the 2024 season, Michigan is just 10-31 ATS (24%) after failing to cover 4 or 5 of their last 6 games, with oddsmakers continuing to price them as if a bounce-back is coming that rarely materializes. With an average scoring deficit of 71.7 to 75.5 in these spots, the data suggests this is more than variance—it points to a team that has been consistently overvalued by the market, making them a prime fade candidate when recent ATS performance trends downward. #NCAABasketball
StatSharp tweet media
English
0
0
0
66
StatSharp
StatSharp@StatSharp·
This tighter threshold puts even more weight on high-level guard play. Houston continues to look strong here because its backcourt rarely gives away possessions. Illinois shows up again because Keaton Wagler and the Illini backcourt keep pressure on the defense without wasting trips. Purdue still benefits from Braden Smith’s elite decision-making, while Alabama’s pace remains dangerous because Labaron Philon helps keep the attack under control. Arkansas also stands out in a big way, which says a lot about how dangerous the Razorbacks become when elite creation is paired with elite ball security. (3/3)
English
0
0
0
56
StatSharp
StatSharp@StatSharp·
Team Turnover Percentage Good: 13.5% or less Bad: 20% or worse Good 2026 NCAA tournament teams Arkansas (12.0%) Wisconsin (12.5%) Houston (12.6%) High Point* (12.7%) Alabama (12.7%) NC State (12.9%) UCLA (12.9%) Illinois (13.0%) Vanderbilt (13.0%) Purdue (13.3%) Clemson (13.5%) Gonzaga (13.5%) Miami (OH) (13.5%) Bad 2026 NCAA tournament teams None (2/3) 🔽
English
1
0
0
93
StatSharp
StatSharp@StatSharp·
🏀March Madness Handicapping * Team Turnover Percentage Low turnover rate has long been one of the strongest indicators of tournament reliability because guard play wins in March. Teams that protect the ball avoid empty possessions, handle pressure better, and are usually better equipped for late-game execution. As the game has evolved, simply being decent with the ball is no longer enough. The most trustworthy tournament teams now tend to be the ones that are truly elite at limiting mistakes. (1/3) 🔽
StatSharp tweet media
English
1
1
1
102
StatSharp
StatSharp@StatSharp·
Tennessee’s number reinforces why the Volunteers are built for physical tournament games. Nate Ament gives them frontcourt star power, while Ja’Kobi Gillespie helps steady the backcourt. Florida also looks dangerous here because Haugh, Condon, and Rueben Chinyelu give the Gators size, activity, and second-chance scoring. Teams that dominate the offensive glass this consistently tend to be far more resilient over the course of a long tournament run.
English
0
0
0
103
StatSharp
StatSharp@StatSharp·
Team Offensive Rebound Percentage Good: 40% or better Bad: 27% or worse Good 2026 NCAA tournament teams Tennessee (44.7%) Florida (43.2%) Bad 2026 NCAA tournament teams Northern Iowa (20.0%) Lehigh* (21.6%) UMBC* (23.3%) Miami (OH) (24.4%) Nebraska (25.3%) Prairie View A&M* (25.8%) Clemson (26.5%) Idaho (26.7%) NC State (26.9%) (2/3) 🔽
English
1
0
0
198
StatSharp
StatSharp@StatSharp·
🏀March Madness Handicapping * Team Offensive Rebound Percentage Offensive rebounding remains one of the most underrated March metrics because it creates extra possessions. More extra possessions means more second-chance points, more foul pressure, and more ways to survive a cold shooting stretch. In a one-and-done format, that kind of margin can swing an entire game. (1/3) 🔽
StatSharp tweet media
English
2
0
0
77
StatSharp
StatSharp@StatSharp·
As the NCAA Tournament tips off, injuries and player availability issues are once again shaping the betting landscape. For bettors and analysts, understanding not just who is out, limited, or unavailable, but how much they are worth to the spread, is critical. A missing starter can change matchups, shorten rotations, and force teams to play in ways they normally would not. Here are the most impactful injuries this March Madness season. statsharp.com/joomla/index.p…
StatSharp tweet media
English
0
1
1
177
StatSharp
StatSharp@StatSharp·
This is one of the most important caution categories in the entire field. Purdue can score with anybody, but this number says it can also get dragged into shootouts. Iowa and UCF have enough offense to stay competitive, but this kind of defensive shot profile puts heavy pressure on them to outscore problems instead of eliminating them. Saint Louis remains one of the most interesting positive outliers because it combines elite shooting with the best defensive EFG% in the field. Michigan and Arizona also get a boost here because they pair strong overall efficiency with real defensive shot suppression.
English
0
0
0
29
StatSharp
StatSharp@StatSharp·
Effective Field Goal Percentage Defense Good: 46% allowed or less Bad: 52% allowed or higher Good 2026 NCAA tournament teams Saint Louis (44.0%) Michigan (44.7%) Arizona (45.0%) Hofstra (45.0%) Kansas (45.2%) Virginia (45.3%) UConn (45.7%) Bad 2026 NCAA tournament teams Queens* (53.6%) NC State (53.1%) Iowa (52.7%) UCF (52.4%) Purdue (52.3%) (2/3) 🔽
English
1
0
0
77
StatSharp
StatSharp@StatSharp·
🏀March Madness Handicapping * Effective Field Goal Percentage Defense Defensive EFG% allowed is one of the best ways to measure whether a defense is truly forcing difficult shots. It captures rim protection, perimeter disruption, and overall shot suppression. In the NCAA tournament, that becomes even more important because unfamiliar gyms and tournament pressure already make offense harder. Teams that can add to that pressure by consistently forcing bad looks become much tougher to eliminate. (1/3) 🔽
StatSharp tweet media
English
1
1
1
115
StatSharp
StatSharp@StatSharp·
This stat helps explain why certain teams are live even if they are not sitting on the top seed line. Purdue’s number reflects the combination of Braden Smith’s orchestration and elite floor spacing around him. Saint Louis stands out because Robbie Avila gives the Billikens scoring, passing, and matchup stress all at once. Michigan’s efficiency is elevated by Lendeborg’s finishing and versatility, while Akron’s strong offensive efficiency plus strong EFG% profile makes it one of the more interesting upset candidates in the bracket.
English
0
0
0
72
StatSharp
StatSharp@StatSharp·
Thresholds Good Teams: 56.5% or better Bad Teams: 50% or worse Good 2026 NCAA tournament teams Miami (OH) (61.2%) Saint Louis (60.0%) Akron (58.8%) Michigan (58.0%) Purdue (57.6%) Utah State (57.3%) Duke (56.8%) Queens* (56.7%) High Point* (56.6%) Iowa (56.6%) Arkansas (56.5%) Iowa State (56.5%) Ohio State (56.5%) Louisville (56.5%) Bad 2026 NCAA tournament teams Prairie View A&M* (49.5%) California Baptist (48.6%) (2/3) 🔽
English
1
0
0
98
StatSharp
StatSharp@StatSharp·
🏀March Madness Handicapping * Effective Field Goal Percentage Effective field goal percentage is one of the clearest measures of offensive shot quality because it properly gives extra value to made three-pointers. Teams with high EFG% are usually creating layups, open threes, or both. That matters enormously in March because strong shot quality tends to hold up better than raw scoring averages when the competition gets tougher. (1/3) 🔽
StatSharp tweet media
English
1
1
1
99
StatSharp
StatSharp@StatSharp·
Bad 2026 NCAA tournament teams Lehigh* (103.8) Prairie View A&M* (104.1) California Baptist (104.2) This is where a lot of the most dangerous teams separate themselves. Illinois owns the best offensive number in the field, and that starts with star freshman guard Keaton Wagler driving the attack. Purdue remains elite offensively because Braden Smith controls tempo and decision-making on almost every trip. Arkansas gets high-end creation from Darius Acuff Jr., Alabama’s pace and scoring pressure run through Labaron Philon, and Florida’s offensive punch is fueled by the versatility of Thomas Haugh and Alex Condon. These are the kinds of players who keep good offenses from going cold when the stakes rise. (3/3)
English
0
0
1
131
StatSharp
StatSharp@StatSharp·
Elite 2026 NCAA tournament teams Illinois (122.9) Miami (OH) (122.4) Purdue (122.3) High Point* (121.7) Akron (120.7) Duke (120.2) Arkansas (120.2) Elite 2026 NCAA tournament teams Illinois (122.9) Miami (OH) (122.4) Purdue (122.3) High Point* (121.7) Akron (120.7) Duke (120.2) Arkansas (120.2) (2/3) 🔽
Eesti
1
0
1
77
StatSharp
StatSharp@StatSharp·
🏀Team Offensive Efficiency Because modern college basketball has become more offense-oriented, the bar for what qualifies as a strong offensive team has to move higher as well. StatSharp research still shows offensive efficiency to be one of the strongest predictive categories in the tournament. Teams that can consistently score at an elite per-possession rate are much better positioned to survive when games slow down, defenses tighten, and late possessions start deciding outcomes. These tournament teams have notable offensive PPP profiles: (1/3) 🔽
StatSharp tweet media
English
1
1
1
104