Basemap
3.8K posts

Basemap
@basemap
Innovative digital mapping & transport data solutions. Specialising in travel time analysis, EV routing, and transport datasets.
Guildford, UK เข้าร่วม Haziran 2009
1.4K กำลังติดตาม1.6K ผู้ติดตาม
Day 29 of the #30DayMapChallenge – Raster
We used OS Zoomstack to find lakes (>0.5 km²) in Cumbria, calculated cycle times to their centroids with TRACC, then styled the output as a raster with hillshading giving it an elevation-map feel.

English
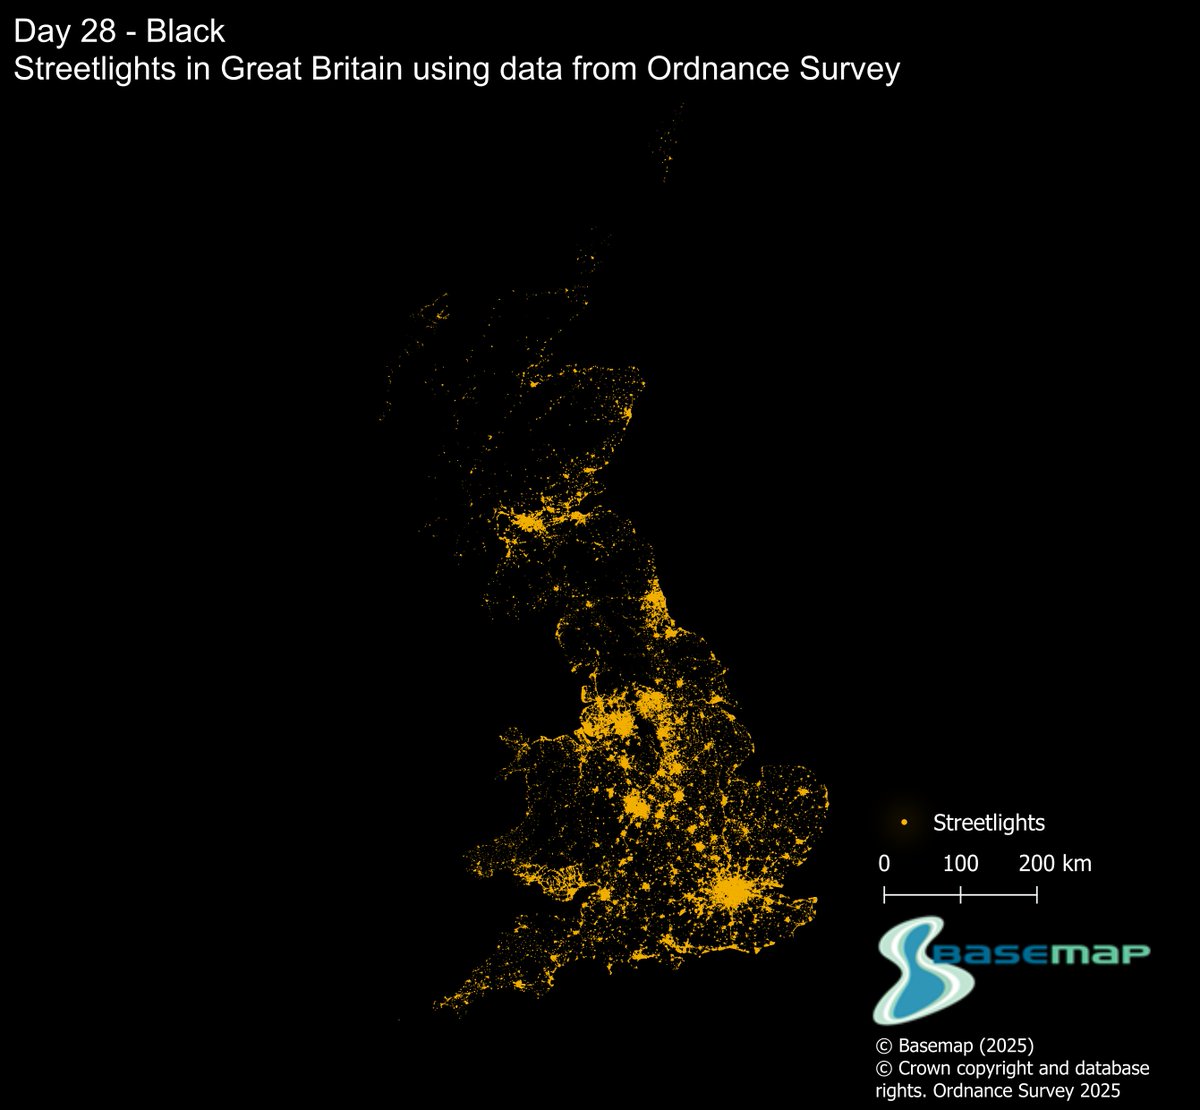
Day 28 of the #30DayMapChallenge Black, using new @OrdnanceSurvey streetlight dataset, we mapped streetlights of GB on a black background.
Even with land visible, streetlights outline the country perfectly and we use it in TRACC to spot unlit roads and plan safer walking routes.
English
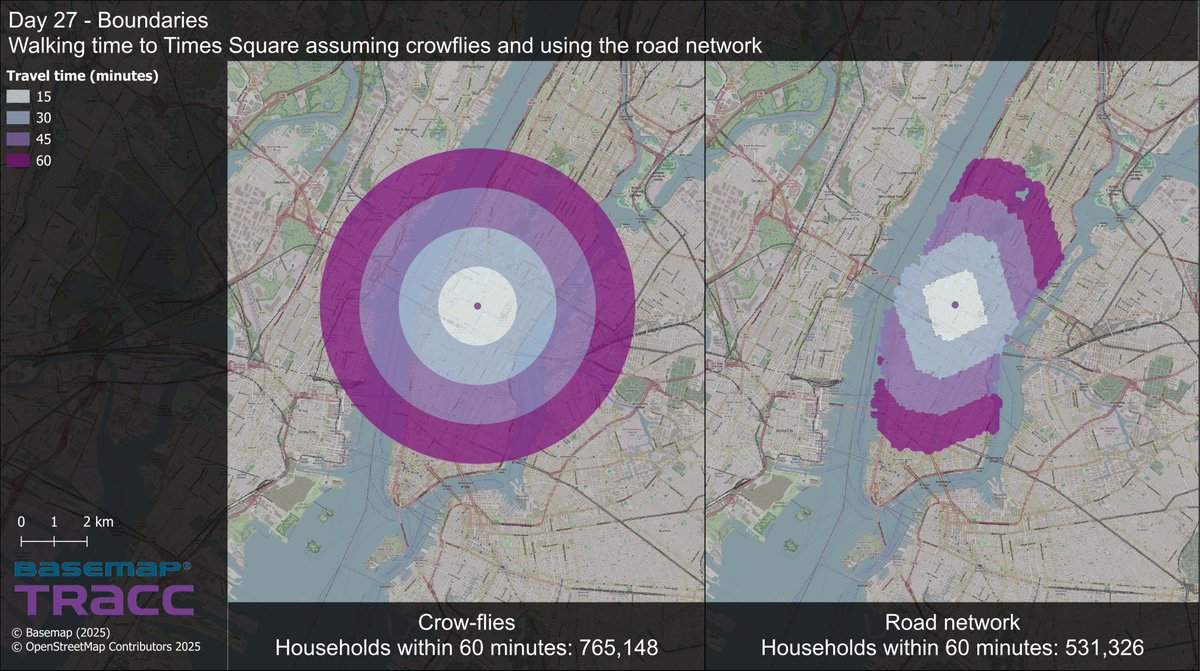
Day 27 of the #30DayMapChallenge Boundaries, we mapped 60-min walking access to Times Square using crow-flies vs the real road network.
• Crow-flies: 765,148 people
• Real network (Hudson/East River as barriers) 531,326
Boundaries matter
#DataViz #Accessibility #NYC #Mapping
English
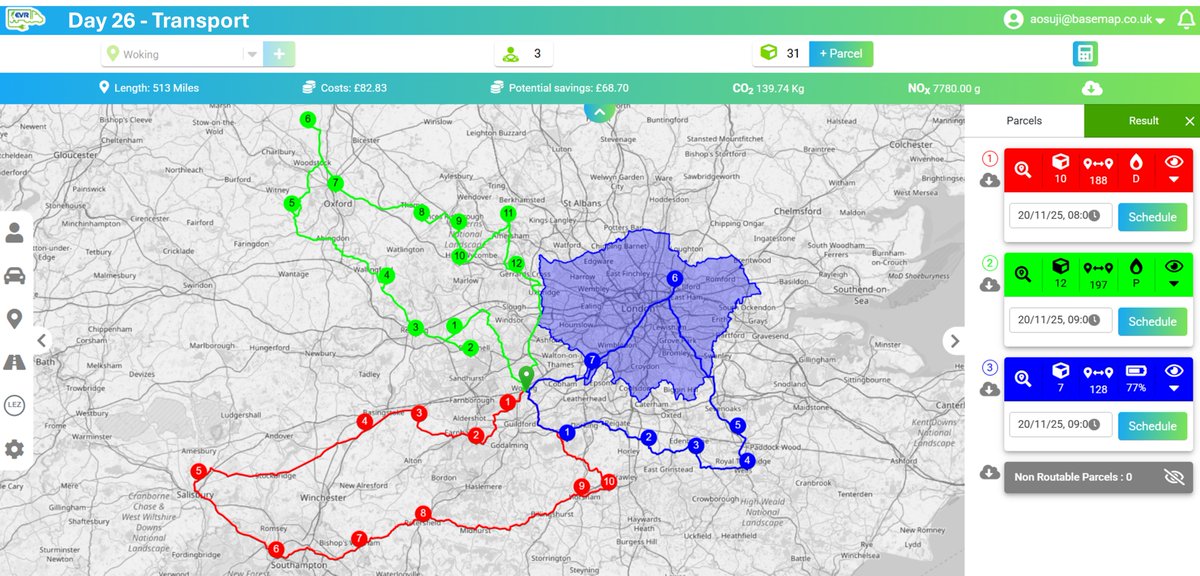
Day 26 of the #30DayMapChallenge Transport
Using EVR, we planned 3 routes from Woking to deliver 31 parcels — including how ULEZ affects petrol/diesel vehicles.
The EV could complete all routes, saving ~£70, 140 kg CO₂, and 7.8 g NOx.
#DataViz #Transport #Routing #EVs #EVR
English
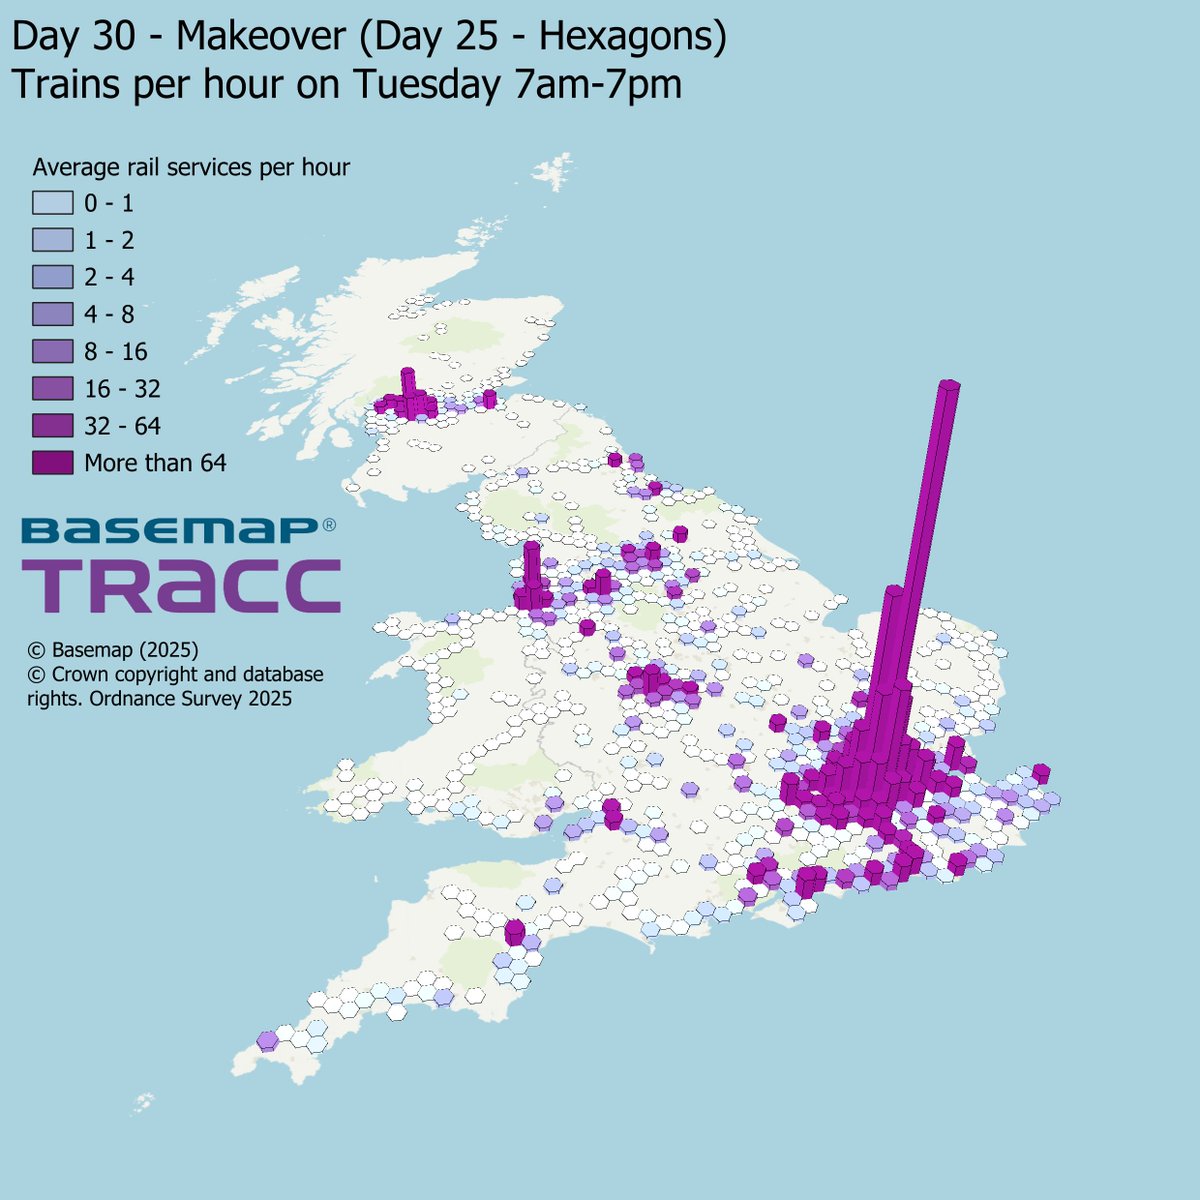
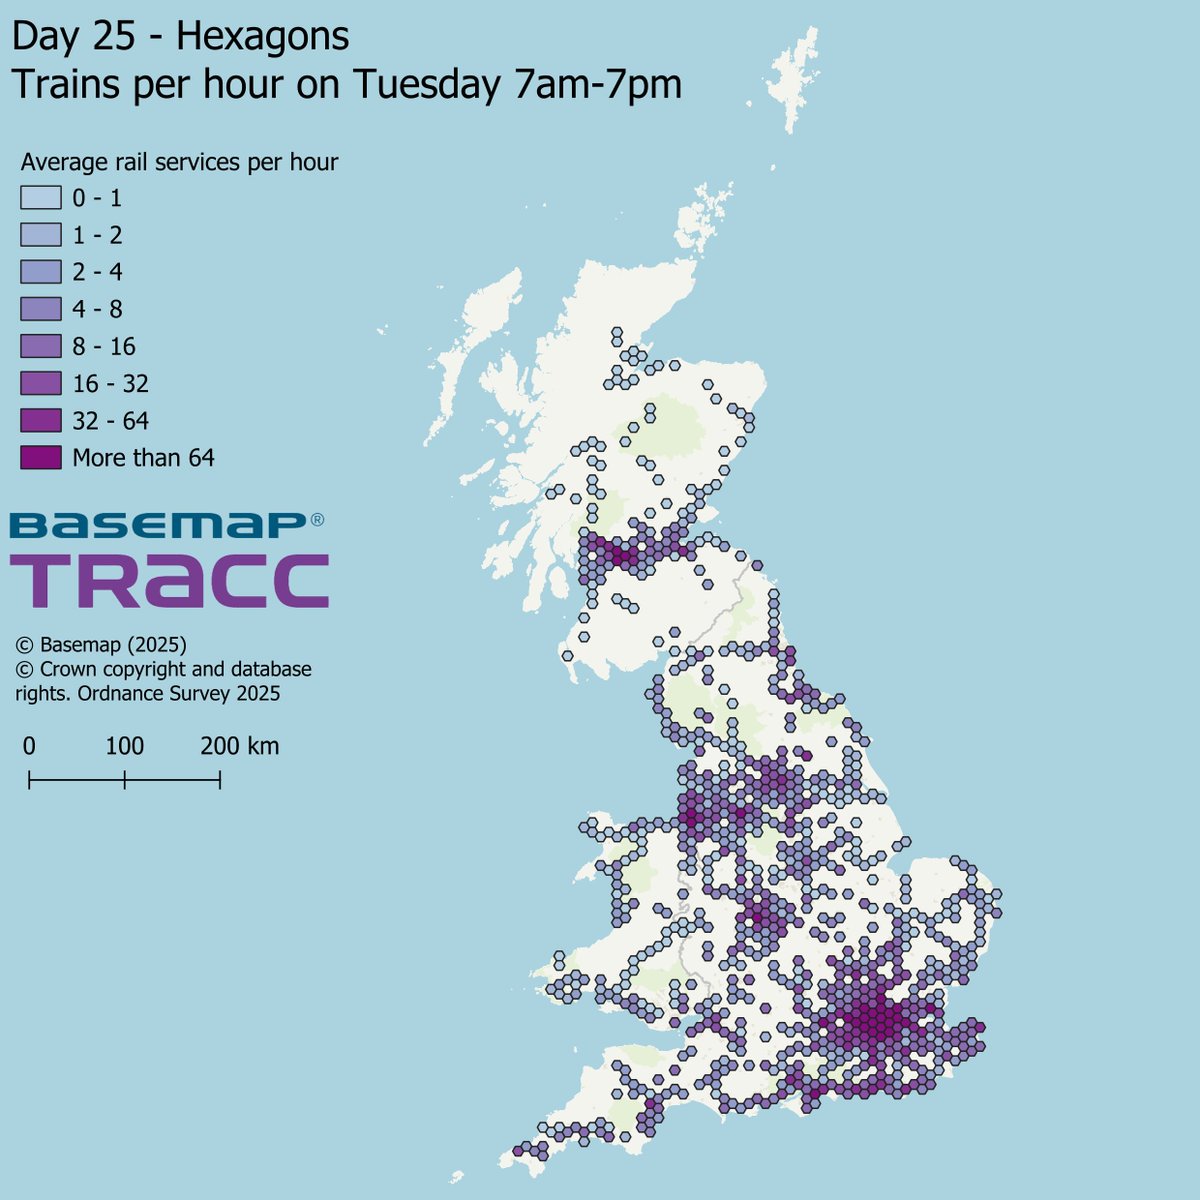
Day 25 of the #30DayMapChallenge Hexagons
We split Great Britain into hexagons and used TRACC to calculate the hourly average number of trains (Tue, 7am–7pm).
Clear hotspots: the South East, Manchester–Liverpool–Leeds, and the Glasgow–Edinburgh corridor.
#DataViz #Rail
English
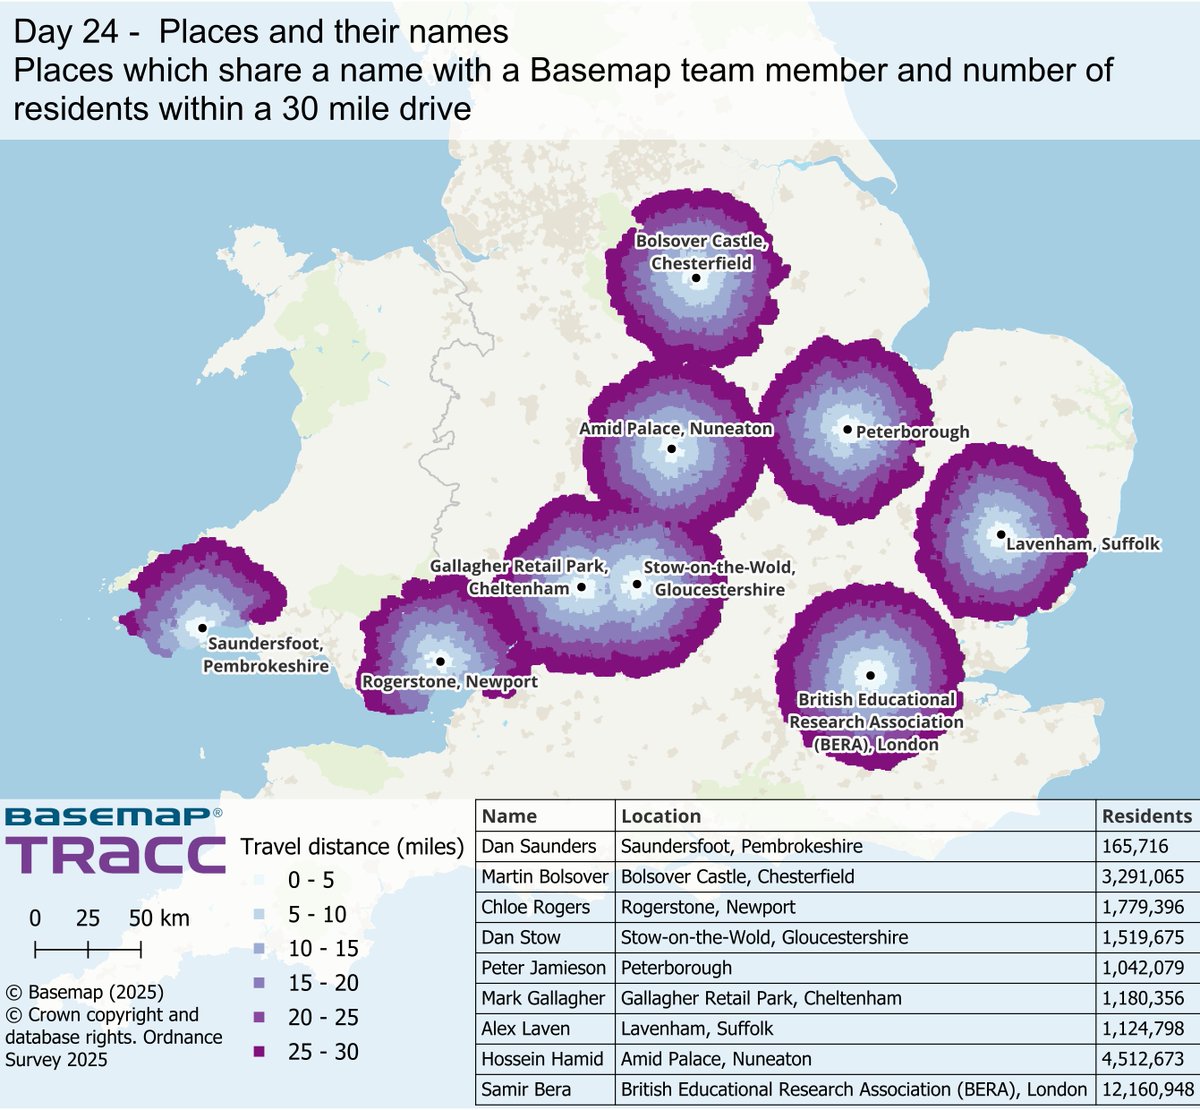
Day 24 of the #30DayMapChallenge – Places and Their Names
We mapped 9 places that share names with staff from Stow-on-the-Wold to Lavenham and calculated how many people live within 30 miles of each.
Winner? Samir Bera over 12 million near “BERA”!
English
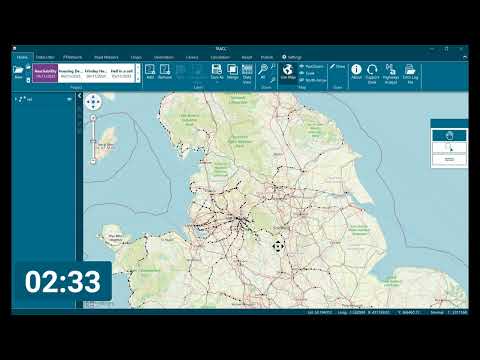
Day 23 of the #30DayMapChallenge – Process
Here’s how we made Map 13 (the 10-minute access map) — in under 9 minutes.
🎥 Full video: youtu.be/E4oXPu2dwEw
#DataViz #Accessibility #TRACC #Basemap
YouTube
English
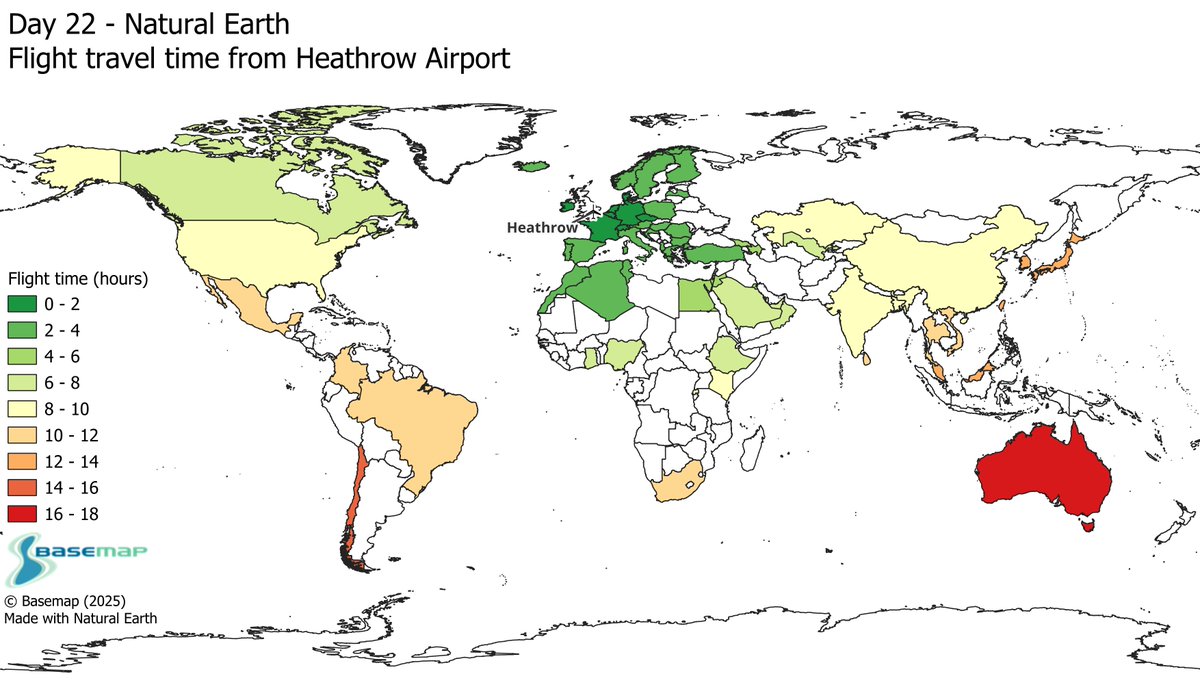
Day 22 of the #30DayMapChallenge – Natural Earth 🌍✈️
We mapped air travel times from @HeathrowAirport using Natural Earth data.
Australia (Perth) tops the list… and yes, we’ve done that direct flight. Long ol’ journey!
#DataViz #Mapping #Aviation #Basemap
English
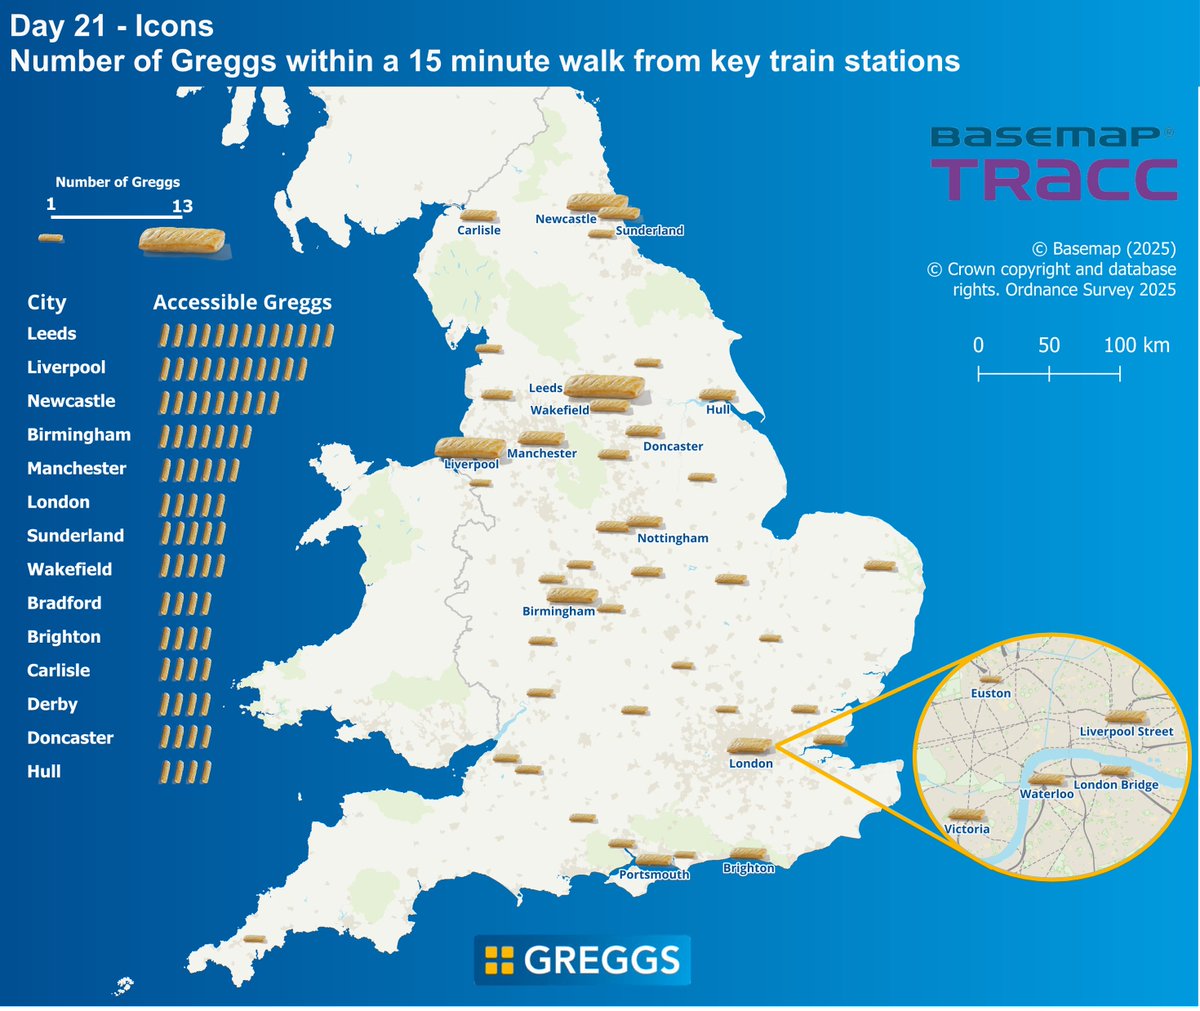
Day 21 of the #30DayMapChallenge – Icons 🥐
What’s more iconic than a @GreggsOfficial sausage roll?
We mapped which stations have the most Greggs within a 15-minute walk, using different-sized sausage rolls to show accessibility with a full sausage roll legend, of course.
English
Day 20 of the #30DayMapChallenge Water
We mapped access to Piazza San Marco by walking + water taxi.
The 30-minute isochrones show how boats connect Venice’s islands slow maybe, but vital for connectivity!
#DataViz #Mapping #Accessibility

English
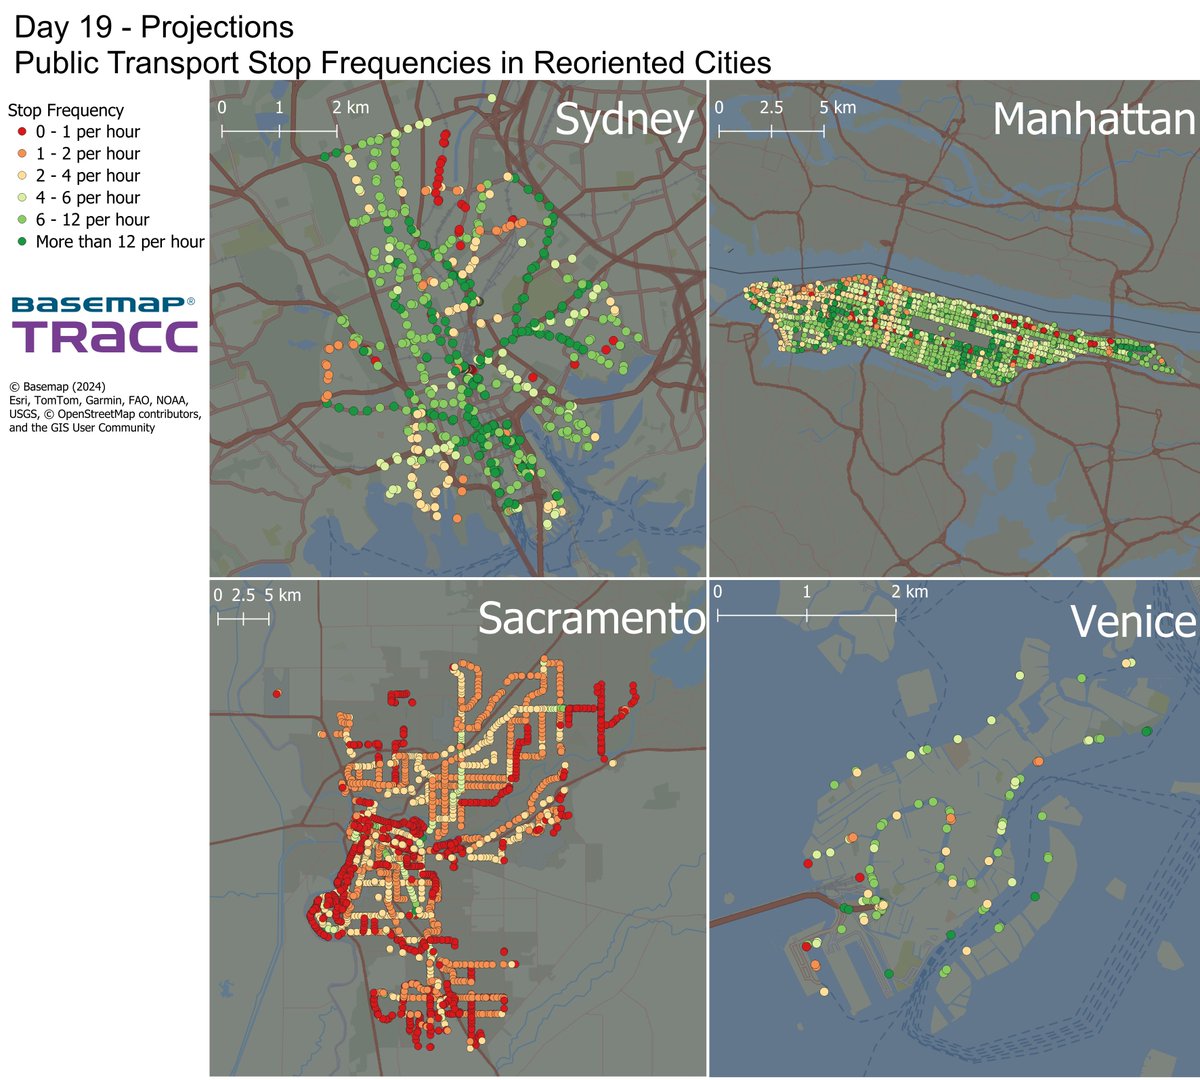
Day 19 of the #30DayMapChallenge Projections
We mapped public transport stop frequencies for Sydney, Manhattan, Sacramento & Venice but with incorrect projections. Amazing to see the contrast between dense cities and Venice’s water taxis, that's a spoiler for tomorrow - water!
English
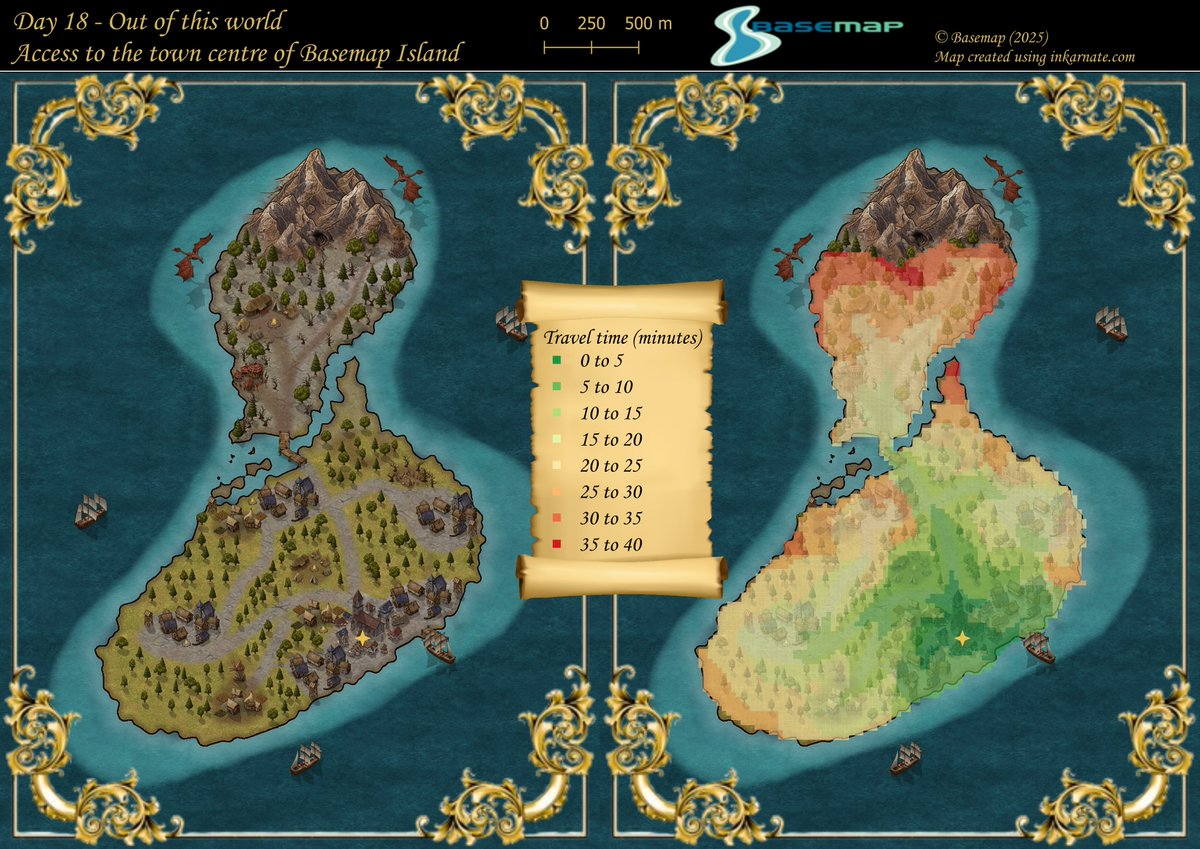
Day 18 of the #30DayMapChallenge Out of This World
We turned the Basemap logo into a fantasy island, complete with a capital city and a walk-time map to the centre.
Out of this world, but still powered by TRACC.
#DataViz #FantasyMap #Accessibility #Basemap
English
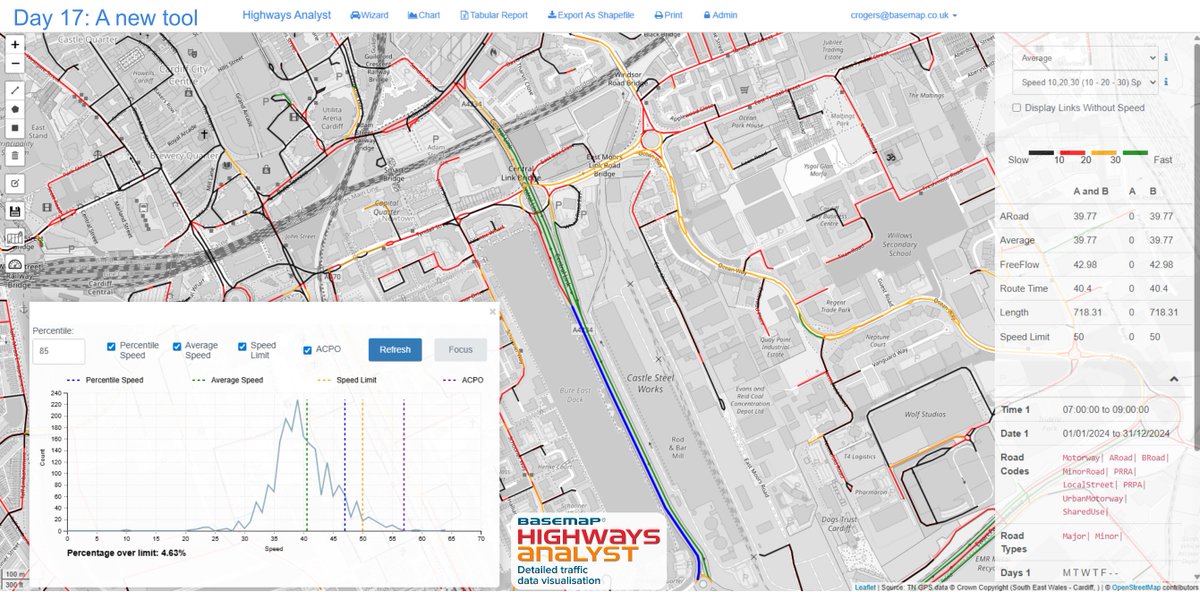
Day 17 of the #30DayMapChallenge – A New Tool or Technique
We’ve used the new Highways Analyst feature to show speeding compliance — combining a map and chart to reveal counts above the limit, averages, and prosecution thresholds.
#DataViz #SpeedData #RoadSafety
English
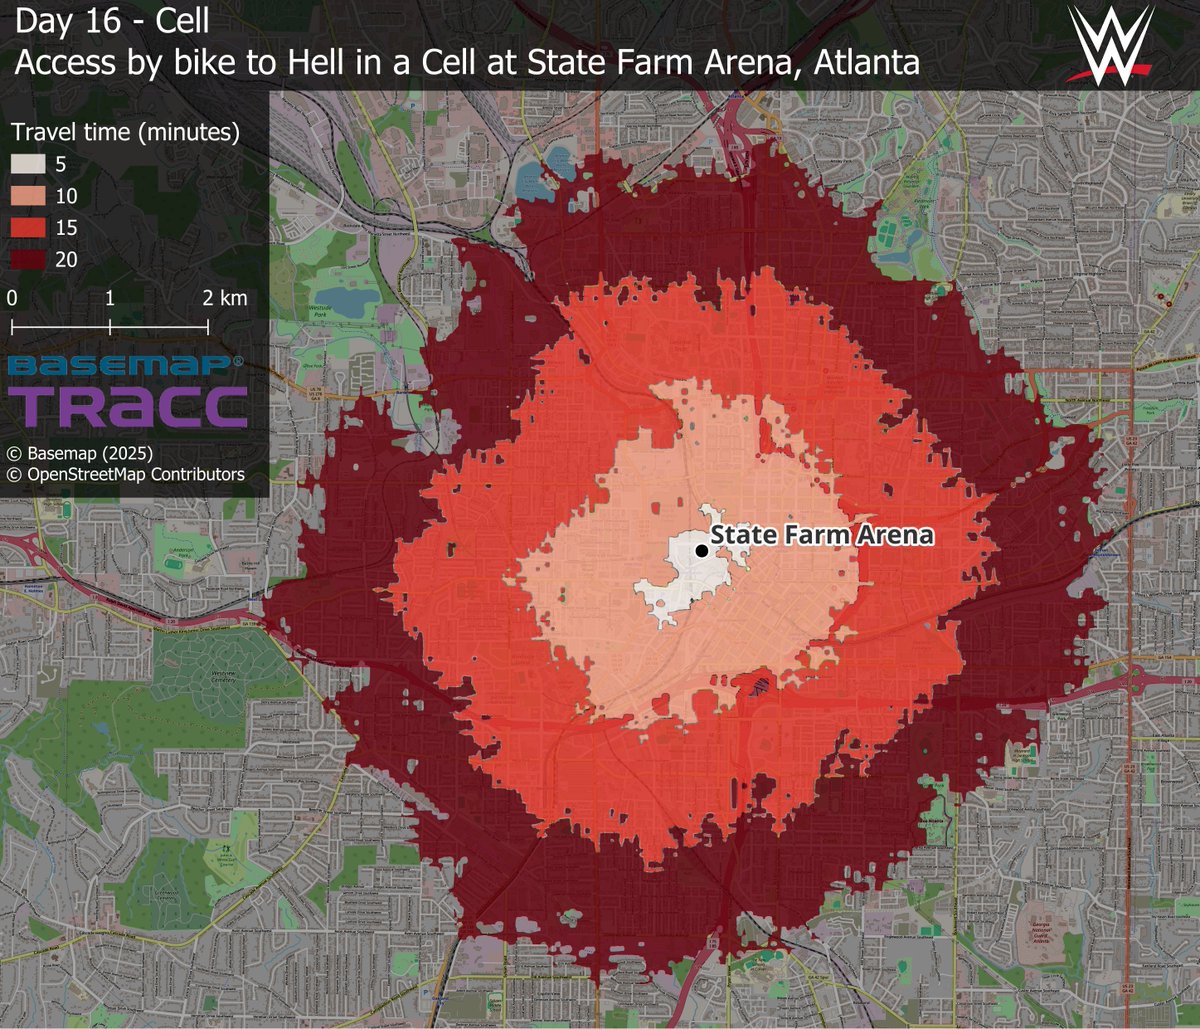
Day 16 of the #30DayMapChallenge Cell
Taking “Cell” literally we mapped cycling access to the 2024 @WWE Hell in a Cell venue in Atlanta, Georgia.
Inspired by CM Punk, who credits cycling as key to his training, we created a 20-minute cycling access map using TRACC.
English
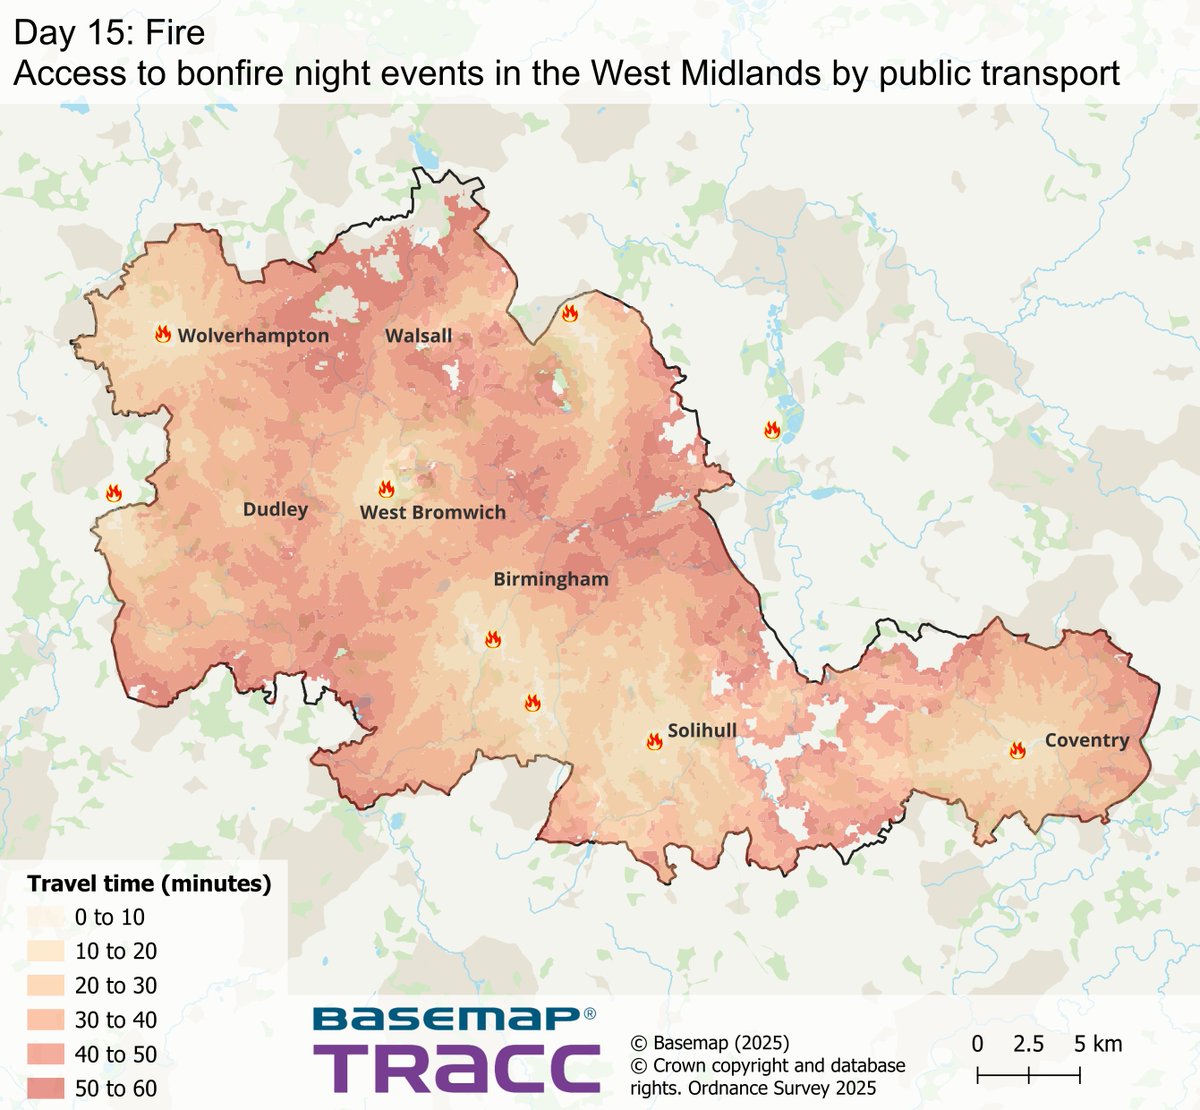
Day 15 of the #30DayMapChallenge Fire
Using TRACC, we mapped public transport access to fireworks displays across the West Midlands and even planned temporary shuttle services for key events.
The result? 🔥 99% of residents within a 60-minute journey.
English
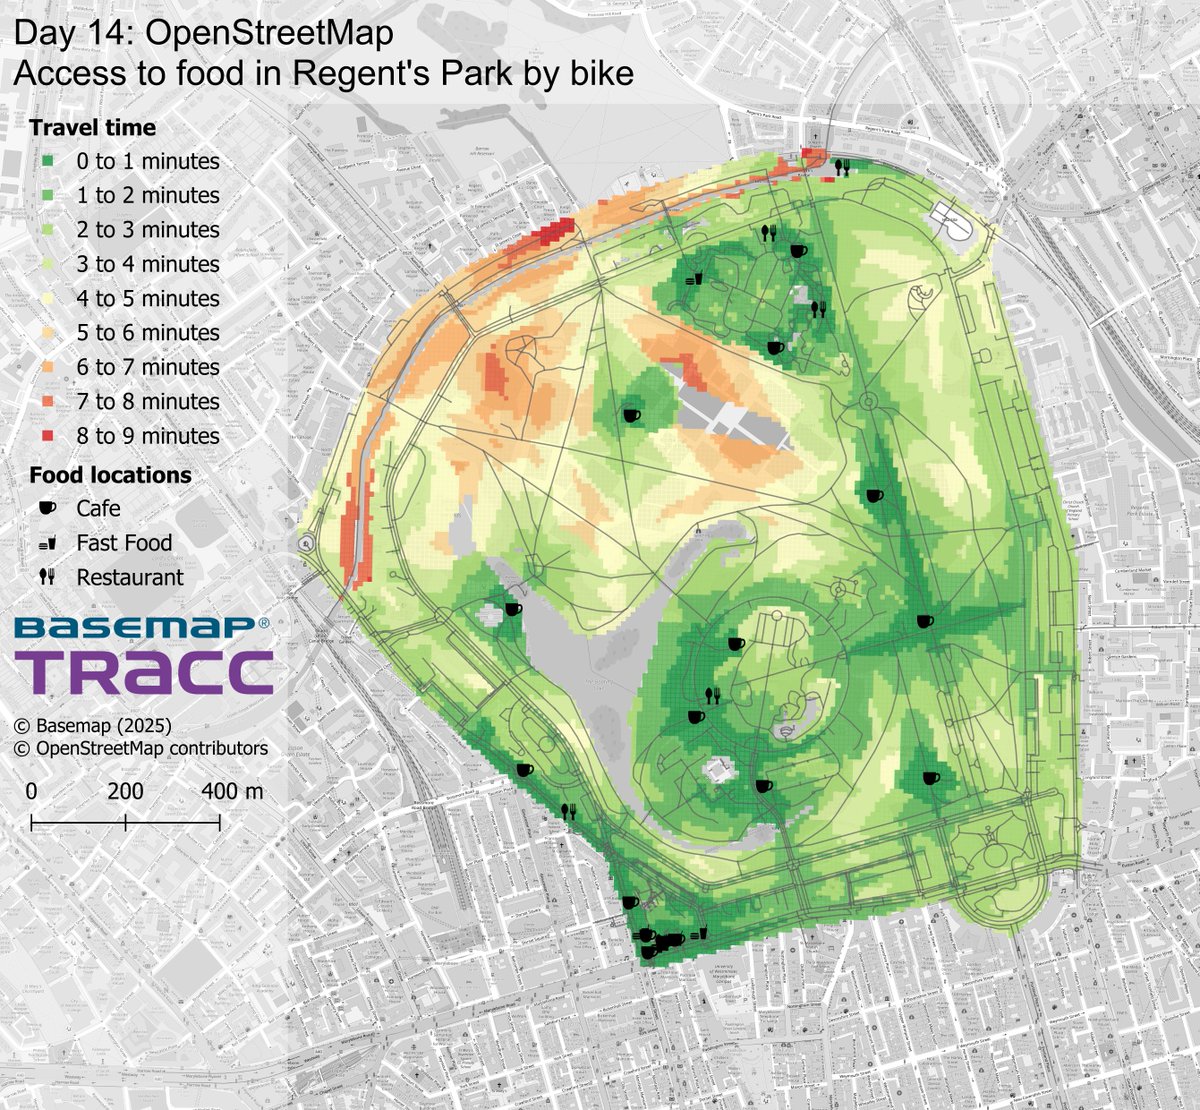
Day 14 of the #30DayMapChallenge OSM
We’ve gone back to where it all began Regent’s Park, London, where Steve Coast made the first @openstreetmap entry in 2004. Using the latest OSM data in TRACC, we mapped cycle times to food POIs around the park a fitting nod to OSM’s roots!
English
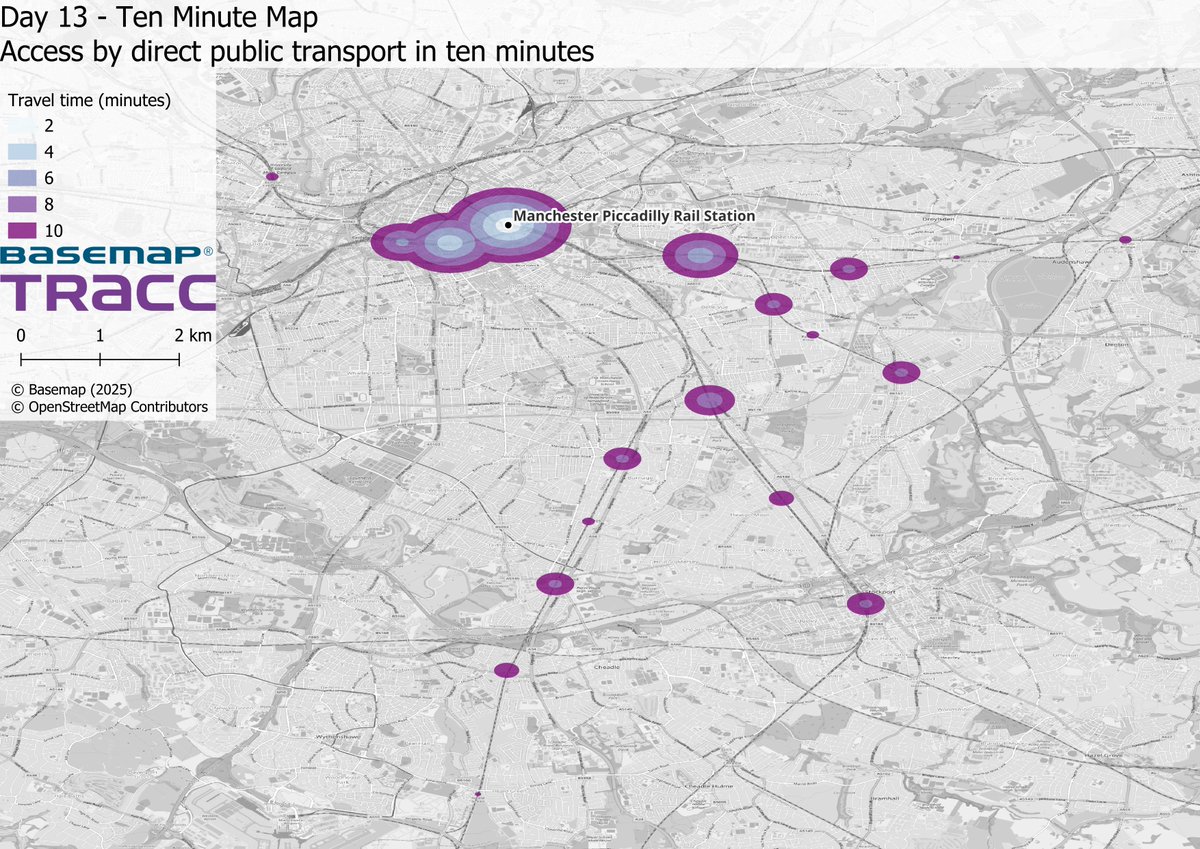
Day 13 of the #30DayMapChallenge A 10 Minute Map
Using TRACC with DataCutter integration, we built a 10 min access map to Manchester Piccadilly.
Import ➜ analyse ➜ export ➜ map.
Watch out for Day 23 — we’ll share the full how-to video (it clocks in at just under 9 minutes
English
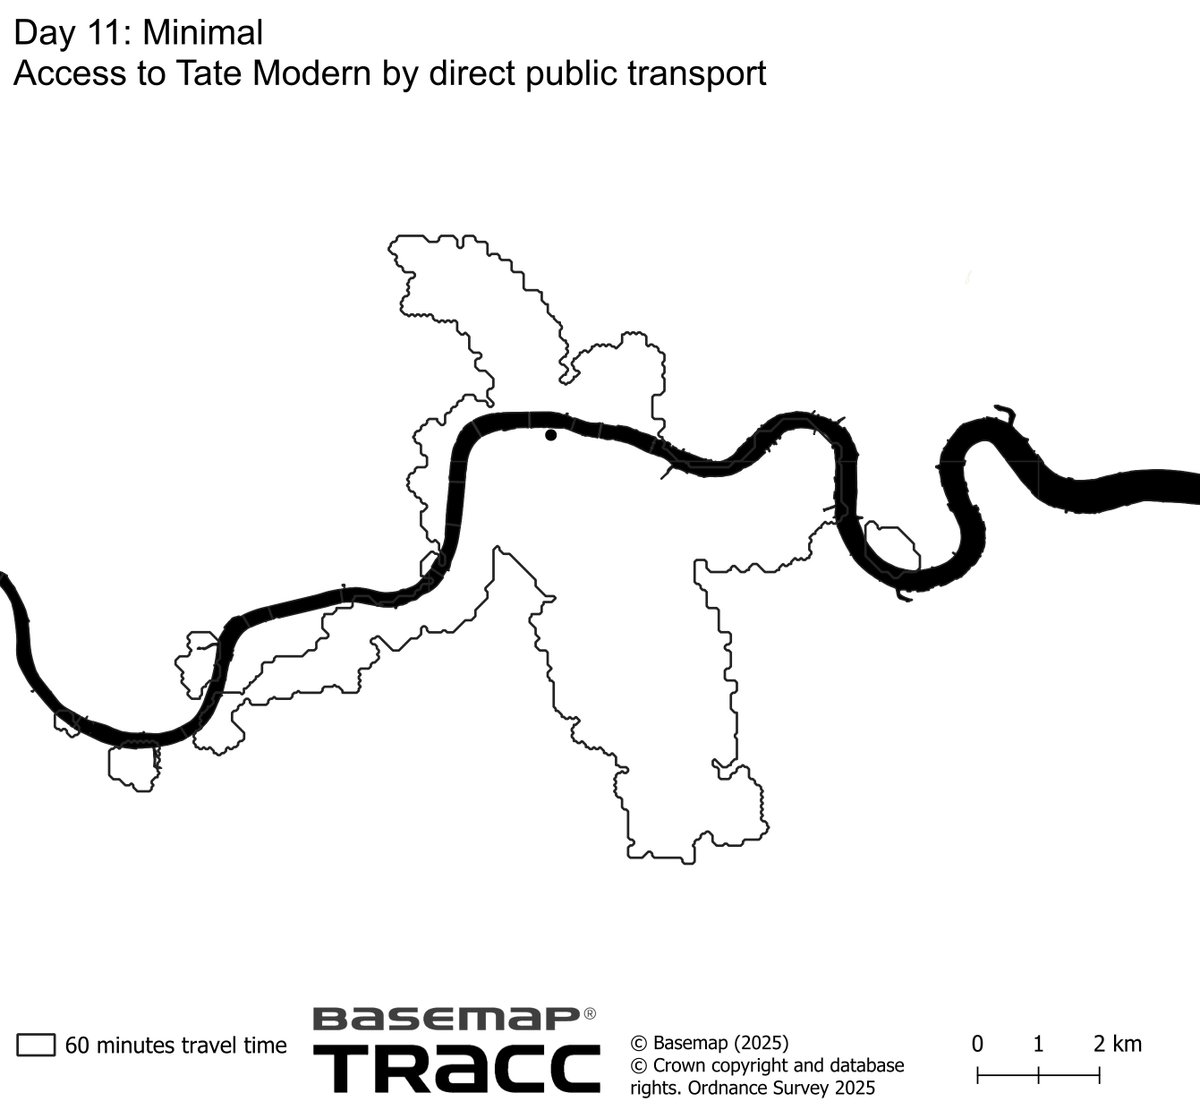
Day 11 of the #30DayMapChallenge Minimal. A single line, a single purpose: travel time to the Tate Modern.
Only direct public transport journeys no interchanges keeping the route as minimal as possible.
Just one contour and the River Thames for context.
Black and white, simple
English