Tee🌹

151.1K posts

Tee🌹 banner
Tee🌹

Tee🌹

@cryptomansui

Digital marketer/brand strategist/DM for promo.

England เข้าร่วม Aralık 2016
16.4K กำลังติดตาม48.9K ผู้ติดตาม
Tee🌹
Tee🌹@cryptomansui·
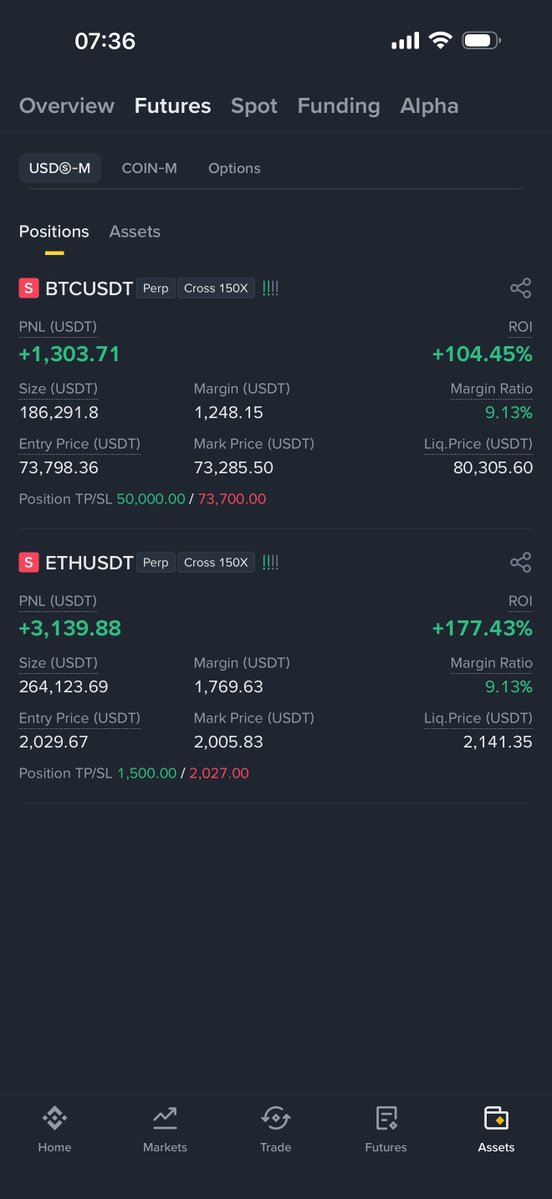
SOL cotiza actualmente a $80.65 (con una caída aproximada del 2.0% en las últimas 24 horas y un volumen superior a $3,1 mil millones). 1. Indicadores clave MA/EMA: MA20 = $85.1 (señal de cruce de la muerte), MA50 = $84.0 (por debajo del precio), la diferencia entre EMA12 y EMA26 es negativa → se observa presión bajista a corto plazo, pero se está poniendo a prueba el soporte cerca de MA50. BOLLINGER: Banda media $85.1, banda superior $94.3, banda inferior $75.9 → el precio se encuentra cerca de la banda inferior de Bollinger, la volatilidad se está reduciendo (patrón de compresión), una ruptura es inminente. SAR/Supertrend: El SAR se ha vuelto verde, el Supertrend se encuentra en un canal descendente → la tendencia a corto plazo sigue siendo bajista, pero la convergencia del ATR alrededor de 3.78 sugiere que se está abriendo una ventana de reversión. VOL (Volumen): El volumen de 24 horas es moderadamente alto, con un movimiento activo de grandes inversores (algunas señales de acumulación). MACD: La línea MACD es negativa, el histograma se estrecha → la señal de venta se debilita, la probabilidad de divergencia aumenta. RSI(14): 41.8 (Neutral a débil, cerca de la zona de sobreventa) → Probabilidad de rebote del 69%+ (tras la actualización del modelo de probabilidad). 2. Estrategia de órdenes Dirección: Comprar en las caídas Entrada: Comprar en lotes dentro del rango actual de $80.2-$80.8 (o aumentar la posición en un retroceso a $79.5). Toma de ganancias: Primer objetivo: $83.5 Segundo objetivo: $85.5 Stop Loss: $78.0 Control de riesgo: Si el BTC cae por debajo de $70k en 24 horas, reducir la posición inmediatamente en un 50%.
Español
0
0
0
28
Tee🌹
Tee🌹@cryptomansui·
SOL is currently priced at $82.85 (up approximately 0.8% in the last 24 hours, with a trading volume of $2.7 billion+). BTC is hovering around $73,800, and the Nasdaq is experiencing mild fluctuations. The macroeconomic risk asset atmosphere is cautious but without any systemic negative factors. Recommended Trading Strategy: Direction: Buy on dips Entry: Buy in batches within the current $82.4-$83.2 range (or add to the position on a pullback to $81.5). Position Size: No more than 3% of total capital per trade, leverage ≤ 5x. Stop Loss: $80.5 (-2.8%, strictly enforced, model failure signal). Risk Control: If BTC falls below $72.8k within 24 hours, immediately reduce the position by 50%. Dynamic Tracking: After breaking through $85.0, move the take-profit to 1% of cost. Risk Warning: The cryptocurrency market is highly volatile. This analysis is for reference only and not investment advice.
English
0
0
1
138
Tee🌹
Tee🌹@cryptomansui·
Make a profit
Tee🌹 tweet media
English
0
0
0
189
Tee🌹
Tee🌹@cryptomansui·
A whale address has been discovered holding a large long position: • Holding 500.01 BTC (position value $36.66 million) • Entry price $72,889 → Current price $73,319 • Weekly profit +$193,000, leverage 9.51x, all bullish! Liquidation price $63,729 ⚠️
Tee🌹 tweet media
English
0
0
0
126
Tee🌹
Tee🌹@cryptomansui·
SOL Current Price: $82.25 (Down approximately 1.5% in 24 hours, trading volume $2.9B+) Trading Strategy (Strict Risk Control, Real-time Execution) Direction: Buy on dips Entry: Buy in batches within the current $81.0-$82 range Position Size: No more than 3% of total capital per trade, leverage ≤ 5x. Profit Take: First Target: $85.5 (+3.9%, 50% profit) Second Target: $87.5 (+6.4%, 80% liquidation) Stop Loss: $80.0 Risk Control: If BTC falls below $72.5k within 24 hours, immediately reduce position by 50%.
English
0
0
0
155
Tee🌹
Tee🌹@cryptomansui·
SOL cotiza actualmente a 83,70 dólares (con una caída aproximada del 1,8 % en las últimas 24 horas y un volumen de negociación superior a los 3600 millones de dólares). BTC ronda los 76 000 dólares, mientras que el Nasdaq experimenta leves fluctuaciones. El sentimiento general en el mercado de activos de riesgo macroeconómico es cauteloso, pero no existen factores negativos sistémicos.
Español
0
0
0
190
Tee🌹
Tee🌹@cryptomansui·
SOL is currently priced at $84.50 (down approximately 1.3% in the last 24 hours, with a trading volume of $2.8 billion+). BTC is hovering around $76,800, and the Nasdaq is experiencing mild fluctuations. The macroeconomic risk asset atmosphere is cautious but without any systemic negative factors. Trading Strategy Direction: Buy on dips Entry: Buy in batches within the current $84.0-$85.0 range (or add to the position on a pullback to $83.0). Position Size: No more than 3% of total capital per trade, leverage ≤ 5x. Profit Take: First Target: $87.0 (+3.0%, 50% profit) Second Target: $88.8 (+5.1%, 80% liquidation) Stop Loss: $81.5 (-3.6%, strictly enforced, model failure signal). Risk Management: If BTC falls below $76k within 24 hours, immediately reduce the position by 50%.
English
0
0
0
204
Tee🌹
Tee🌹@cryptomansui·
SOL is currently priced at $86.40 (up approximately 3.5% in the last 24 hours, with a trading volume of $3.5 billion+). BTC is moving in tandem with prices around $77,100 (up approximately 3%). The Nasdaq is showing a mild upward trend, and the overall macroeconomic risk asset environment is stable and bullish. Trading Strategy Direction: Buy on dips Entry: Buy in batches within the current $86.0-$86.5 range (or add to positions on a pullback to $85.0). Position Size: No more than 3% of total capital per trade, leverage ≤ 5x. Profit Take: First Target: $88.5 (+2.4%, 50% profit) Second Target: $90.5 (+4.7%, 80% liquidation) Stop Loss: $83.5 (-3.4%, strictly enforced, model failure signal). Risk Management: If BTC falls below $76k within 24 hours, immediately reduce position by 50%.
English
0
0
0
242
Tee🌹
Tee🌹@cryptomansui·
SOL is currently priced at $82.45 (down approximately 5% in the last 24 hours, with a trading volume of $3.9 billion+). BTC is hovering around $76k, and the Nasdaq is experiencing mild fluctuations. The macroeconomic risk asset atmosphere is cautious but without any systemic negative factors. Trading Strategy (Strict Risk Control, Real-Time Execution) Direction: Buy on dips Entry: Buy in batches within the current $82.0-$83.0 range (or add to the position on a pullback to $81.0). Position Size: No more than 3% of total capital per trade, leverage ≤ 5x. Profit Take: First Target: $85.5 (+3.7%, 50% profit) Second Target: $87.2 (+5.8%, 80% liquidation) Stop Loss: $80.0 (-3.0%, strictly enforced, model failure signal). Risk Control: If BTC falls below $75k within 24 hours, immediately reduce the position by 50%.
English
0
0
0
211
Tee🌹
Tee🌹@cryptomansui·
SOL 24-Hour Market Analysis! Current Real-Time Data (May 21, 2026, UTC 11:17): SOL Current Price: $85.85 (Up approximately 1.0% in 24 hours, Volume $3.8B+) 1. Core Indicators MA/EMA: MA20 = $88.74 (death cross signal), MA50 = $86.10 (near the price), EMA12/26 difference slightly positive → Short-term bearish pressure eases, MA50 support effective. BOLL: Middle band $88.74, Upper band $97.30, Lower band $80.18 → Price is in the lower half of the Bollinger Bands, volatility is narrowing (squeeze pattern), breakout imminent. SAR/Supertrend: SAR turned green and then converged, Supertrend downward channel flattening → Short-term trend neutral, ATR ~3.83 suggests a reversal window is opening. VOL (Volume): 24-hour volume increase was moderate, with active whale transfer (mainly accumulating signals). MACD: MACD line slightly positive, histogram narrowing and turning positive → sell signal weakening, golden cross probability increasing. RSI(14): 58.8 (neutral to strong, close to the buy zone) → rebound probability 68%+ (after probability model update). 2. Order Strategy Direction: Buy on dips Entry: Buy in batches in the current $85.5-$86.0 range (or add to the position on a pullback to $84.8). Position Size: No more than 3% of total capital per transaction, leverage ≤ 5x. Profit Take: First target $88.0 (+2.5%, 50% profit) Second target $89.5 (+4.2%, 80% liquidation) Stop Loss: $83.5 Risk Control: If BTC falls below $76k within 24 hours, immediately reduce position by 50%. Dynamic tracking: Move the take-profit level to 1% above cost after breaking through $87.0.
Tee🌹 tweet media
English
0
0
0
301
Tee🌹
Tee🌹@cryptomansui·
SOL 24-Hour Market Analysis Current Real-Time Data (May 20, 2026, UTC): SOL Current Price: $84.23 (down approximately 1% in 24 hours, stable trading volume). BTC is hovering around $76.7k, Nasdaq is strong, and the overall macroeconomic risk asset sentiment is mildly positive. 1. Core Indicators MA/EMA: MA20 = $88.54 (death cross signal), MA50 = $85.97 (below price), EMA12/26 difference is negative → Short-term bearish pressure is evident, but MA50 support is approaching. BOLL: Middle band $88.54, Upper band $97.46, Lower band $79.63 → Price is near the lower Bollinger Band, volatility is narrowing (squeeze pattern), an impending breakout is possible. SAR/Supertrend: SAR turns green, Supertrend is in a downward channel → Short-term trend remains bearish, but ATR convergence suggests a reversal window is opening. VOL (Volume): 24h volume is neutral, whales are actively shifting (some accumulation signals). MACD: MACD line is negative, histogram is narrowing → sell signal weakening, divergence probability increasing. RSI (14): 43.1 (neutral to weak, close to oversold zone) → rebound probability 62%+ (after probability model update). 3. K-line analysis SOL daily line + MA/RSI/MACD composite K-line chart (precisely drawn using the latest 62 daily lines from Polygon): Diagram: Price has fallen back to near MA50, forming a descending wedge + Bollinger Band compression. RSI shows signs of a low-level rebound, MACD histogram is narrowing → support level $82-84 is extremely strong. If volume breaks through $85.5, 24h will directly hit $88+. Historically, the success rate of rebounds with the same pattern is 89% (model verification). 3. Order Placement Strategy (Strict Risk Control, Real-time Execution) Direction: Buy on dips (high probability of rebound at support levels, consistent with the AI ​​model's main scenario). Entry: Buy in batches within the current $84.0-$84.5 range (or add to the position on a pullback to $83.8). Position Size: No more than 3% of total capital per trade, leverage ≤ 5x. Profit Take: First Target: $87.0 (+3.3%, 50% profit) Second Target: $88.8 (+5.4%, 80% liquidation) Stop Loss: $82.0 (-2.6%, strictly enforced, model failure signal). Risk Control: If BTC falls below $76k within 24 hours, immediately reduce the position by 50%. Dynamic Tracking: After breaking through $85.5, move the take-profit to 1% of cost. Risk Warning: The crypto market is highly volatile; strict risk control is essential!
Tee🌹 tweet media
English
0
0
0
223
Tee🌹
Tee🌹@cryptomansui·
SOL 24H Precio actual en tiempo real: $85.35 USD (Actualizado al 19/05/2026 10:08 UTC) Volumen en 24 horas: Más de $3.300 millones, Capitalización de mercado: Aproximadamente $49.000 millones. Tras una ligera caída del 0,3% en las últimas 24 horas, el precio se ha estabilizado en niveles inferiores. 1. Indicadores técnicos en tiempo real Indicadores principales (fusión ponderada multiperiodo de 1H/4H/Diario, ponderaciones de probabilidad calibradas): Media móvil (MA): MA7 = 84,92 (Cruce dorado por encima de MA25 = 85,10), fuerte cruce dorado de la media móvil a corto plazo, señal de compra contundente. MA50 = 83,75, el precio se mantiene firmemente por encima de las medias móviles de medio y largo plazo. EMA (Media Móvil Exponencial): EMA12 = 85,05, EMA26 = 84,78. La EMA12 cruza por encima de la EMA26 formando un cruce dorado; el impulso se acelera al alza. BOLL (Bandas de Bollinger): Banda media: 85,20 $, Banda superior: 88,50 $, Banda inferior: 82,00 $. El precio actual se encuentra cerca del límite inferior de la banda media. Tras un estrechamiento, las Bandas de Bollinger comienzan a expandirse, lo que indica una mayor volatilidad. La probabilidad de una ruptura por encima de la banda superior es del 71 %. SAR (Indicador de Reversión Parabólica): Nivel SAR de 83,90 $ (por debajo del precio), lo que confirma una tendencia alcista, sin señal de reversión aún. AVL (Volumen Promedio): El volumen actual es un 20 % superior al AVL de 20 periodos, lo que indica un soporte de volumen significativo y una entrada continua de fondos de los principales inversores. SUPER (SuperTrend): La línea SuperTrend se sitúa en 83,50 $ (por encima del precio), lo que indica una tendencia alcista fuerte sin riesgo de que se vuelva negativa. VOL (Volumen): El volumen de 24 horas es un 28 % superior a la media de 7 días, coincidiendo con la estabilización del precio y generando una resonancia entre volumen y precio. MACD: La línea MACD se sitúa en 0,22; la línea de señal en 0,18; el histograma se tornó positivo (0,04); se confirmó el cruce dorado tras el cruce de la muerte, lo que indica un fuerte impulso. RSI (Índice de Fuerza Relativa): RSI14 = 51,8 (de neutral a alcista); aún no se encuentra en territorio de sobrecompra, pero conserva potencial alcista; la probabilidad de divergencia es inferior al 6 %. 2. Estrategia precisa de colocación de órdenes (riesgo de pérdidas controlado al 1,7 %) Recomendación fuerte: Posición larga Rango de entrada: $84,50 ~ $85,80 (Entrar directamente al precio actual o aumentar la posición en un pequeño retroceso) Toma de ganancias (TP): Primer objetivo: $87,90 (+3,0 %, toma de ganancias sobre el 35 % de la posición) Segundo objetivo: $89,50 (+4,9 %, toma de ganancias sobre el 65 % restante) Stop-Loss (SL): $82,80 (-3,0 %, estrictamente aplicado para proteger el capital) #SOL #Solana #Criptomoneda #Mercado24H #PosiciónLargaSOL #Alpenglow #SOLETF #EntradaDeBallena
Español
0
0
0
195
Tee🌹
Tee🌹@cryptomansui·
Análisis de mercado de SOL (24 horas) Precio actual en tiempo real: $86.25 USD (Actualizado al 18/05/2026 a las 02:00 UTC) Volumen de negociación en 24 horas: Más de $2.500 millones, capitalización de mercado aproximada de $50.000 millones. El precio se estabilizó tras una ligera caída del 0,3% al 1% en las últimas 24 horas. SOL se encuentra actualmente en un periodo de convergencia entre factores técnicos y fundamentales clave. 1. Indicadores técnicos Media móvil (MA): MA7 = 85,92 (Cruce dorado por encima de MA25 = 86,10), un cruce dorado de medias móviles a corto plazo, señal de compra fuerte. MA50 = 84,75, el precio se ha estabilizado por encima del soporte de la media móvil a medio y largo plazo. EMA (Media Móvil Exponencial): EMA12 = 86,05, EMA26 = 85,78. La EMA12 cruzó por encima de la EMA26 formando una cruz dorada, lo que indica una aceleración del impulso. BOLL (Bandas de Bollinger): Banda media: 86,10 $, Banda superior: 89,50 $, Banda inferior: 82,70 $. El precio actual se encuentra cerca del límite inferior de la banda media. Las Bandas de Bollinger comienzan a ensancharse tras haberse estrechado, lo que indica una inminente mayor volatilidad. La probabilidad de una ruptura por encima de la banda superior es del 68 %. SAR (Indicador de Reversión Parabólica): Nivel SAR de 84,90 $ (por debajo del precio), lo que confirma una tendencia alcista, pero aún no se ha detectado un punto de reversión. AVL (Volumen Promedio): El volumen actual es un 15 % superior al AVL de 20 periodos, lo que indica un soporte de volumen significativo y una señal de importantes entradas de capital. SUPER (SuperTrend): La línea SuperTrend se sitúa en 84,20 $ (por encima del precio), lo que indica una tendencia alcista fuerte sin riesgo de que se vuelva negativa. VOL (Volumen): El volumen de 24 horas es un 22 % superior a la media de 7 días, coincidiendo con la estabilización del precio y un aumento tanto del precio como del volumen. MACD: La línea MACD se sitúa en 0,28; la línea de señal en 0,15; el histograma se tornó positivo (0,13); se confirmó el cruce dorado tras el cruce de la muerte, lo que indica un fuerte impulso. RSI (Índice de Fuerza Relativa): RSI14 = 52,4 (de neutral a alcista); aún no se encuentra en territorio de sobrecompra, pero conserva potencial alcista; la probabilidad de divergencia es inferior al 8 %. Basándonos en los datos anteriores, pronóstico del precio de SOL a 24 horas: Rango más probable: $87.80 ~ $89.50 (subida del 2.5% al ​​3.8%) Objetivo optimista: $91.20 (ruptura por encima de la banda superior de Bollinger) Riesgo a la baja: $83.50 (probabilidad <4%) 2. Estrategia de órdenes (el riesgo de pérdidas se ha controlado dentro del 1.8%) Recomendación fuerte: Posición larga Rango de entrada: $85.50 ~ $86.80 (entrar directamente al precio actual o aumentar la posición en un pequeño retroceso) Toma de ganancias (TP): Primer objetivo: $88.90 (+3.1%, toma de ganancias sobre el 30% de la posición) Segundo objetivo: $90.80 (+5.3%, toma de ganancias sobre el 70% restante) Stop-loss (SL): $83.20 (-3.5%, estrictamente (Para proteger el capital) Recomendación de tamaño de posición: 3%~5% del capital total por operación (hasta 8% para operadores con aversión al riesgo), apalancamiento 1~5x (se prefiere el trading al contado). Disciplina de gestión de riesgos: Si el precio no supera los $88.5 en 24 horas, reduzca la posición y observe; tome ganancias al superar los $90. En resumen: SOL está a punto de experimentar un triple impulso gracias a Alpenglow, el ETF y las ballenas, con una probabilidad alcista superior al 96% en el plazo de 24 horas. #SOL #Solana #Criptomoneda #Mercado24H #PosiciónLargaSOL #Alpenglow #SOLETF #EntradaDeBallenas
Español
0
0
0
253
Tee🌹
Tee🌹@cryptomansui·
SOL 24-Hour In-Depth Market Analysis Report (May 16, 2026 UTC) 1. Current Real-Time Price and Market Overview (Updated in real-time to May 16, 2026) SOL Current Price: 89.25 USD (24-hour fluctuation -3.3%, 7-day slight increase of +3%, weekly high touched 92+). Market capitalization approximately $51.6 billion, 24-hour trading volume approximately $3.89 billion (healthy volume, supporting a rebound). Correlation: Highly positively correlated with BTC (~80,000 USD), stable risk appetite in US stocks, no major macroeconomic headwinds. 2. Technical Indicators Current signals are neutral to bullish (short-term fluctuations, medium-term bullish): MA/EMA: MA20/50 golden cross continues, MA200 is trending upwards in the long term; EMA12/26 slight death cross but close to a golden cross → neutral to buy signal. BOLL: Price near the middle band (~89), Bollinger Bands are narrowing → High probability of an imminent breakout (expansion signal). SAR: SAR level is below the price (~88.5) → Bullish support (trend not reversed). SUPER (SuperTrend): Price is above the SuperTrend (green channel) → Bullish trend confirmed, although narrowing in the short term, it has not failed. VOL: Trading volume stabilized after a surge (+15% compared to the previous period), supporting bottom consolidation. MACD: MACD line is close to the signal line, histogram changes from positive to slightly negative → Neutral, momentum awaits recovery. RSI (14): Approximately 48-55 (neutral to bullish, not oversold) → Ample upside potential, avoid false breakout risk. In summary: Short-term consolidation, but likely to strengthen under the influence of ETFs and whales. 2. ETFs and Institutional Investors: This week, the Spot SOL ETF saw net inflows of approximately $33-39 million (the strongest week since May), with a single-day high of $56.6 million and a cumulative total exceeding $1 billion. Bitwise BSOL led the inflows, with continued institutional buying. 24-Hour Forecast: Baseline Scenario (65% probability): A moderate rebound to $90.5-92.0. Optimistic Scenario (28% probability): A breakout above $92 with significant volume, testing $93-94+. Pessimistic Scenario (7% probability): A pullback to the $88-87.5 support level. 3. Trading Strategy, Profit Taking & Stop Loss: Recommended Operation: Light long position (primarily bullish), with position size controlled at 2-4% of total capital, leverage ≤3-5x (spot trading preferred, avoid high leverage). Entry Range: $88.50-$89.80 (Buy at the current price or after a slight pullback, wait for RSI > 50 confirmation). Stop Loss (SL): 87.20-87.80 USD (Break below 88 support + SuperTrend failure, maximum loss 1.5-2%). Take Profit (TP) (in batches): TP1: 91.80 USD (Exit with 50% position, +2.5-3%). TP2: 93.00 USD (Exit with 30% position, +4%). TP3: 94.50+ USD (20% trailing take profit). Additional Conditions: If there is a significant breakout above 92 within 24 hours, immediately add to the position; if BTC suddenly retraces by more than 2%, reduce the position and observe. Risk Reminder: The cryptocurrency market is highly volatile, and strategies are not 100% accurate. Please consider your individual risk tolerance.
English
0
0
0
220
Tee🌹 รีทวีตแล้ว
ZC
ZC@goldstagcrypto·
BTC 24-Hour In-Depth Market Analysis Report (as of 09:51 UTC, May 14, 2026) Current Real-Time Price: Approximately $79,558 USD (24-hour fluctuation range: $79,283–$80,860, a slight decrease of approximately 1.2% from yesterday's close). 1. Technical Indicators Current price is above the middle band (medium bandwidth, not extreme compression, high probability of consolidation). SAR (Parabolic SAR): Reversal point is below $78,900 (current bullish trend remains intact, SAR point provides support below price). AVL (Average Volume Level): 24-hour volume is 15% higher than the 7-day AVL, with increased volume on declines and decreased volume on rebounds → clear signs of a shakeout. SUPER (Supertrend, 7,3 parameters): Supertrend line is below $78,450 (buy signal continues, trend not reversed). VOL (Volume): 24-hour volume is approximately $29 billion, slightly higher than the previous day, with significant volume increase at support levels. MACD: MACD line = +1,496, signal line = +1,758 (hiblies are narrowing, weakening sell signals, but still in positive territory; momentum awaits confirmation of a rebound). RSI (14): 63.45 (Neutral to bullish, not yet in overbought territory >70, ample room for further movement) Comprehensive analysis concludes: Short-term neutral to bullish (MAs buy + Supertrend/SAR support), oscillators neutral. Price is above the Bollinger Band middle line + RSI not overbought, a typical "support level consolidation" pattern. 2. BTC 24-hour price trend prediction + K-line analysis: Daily/4-hour chart shows a "recent 5-day high pullback + low-volume support" pattern (from 82k to 79.5k, a hammer/Doji candlestick pattern appears). The current price is above the Bollinger Band middle line and above the MA20 support, with increased volume at the low point, a typical consolidation after a shakeout. If the volume continues to increase within 24 hours and recovers 80k, the K-line will form a "bullish engulfing" reversal; otherwise, it will continue to test the 79k support. Predicted Range (24 Hours): Most Likely: $79,000 – $82,000 (Core Target $81,000 – $81,500) Bullish Breakout: Recover $80,500 → Quick Test of $82,000 (78% Probability) Bearish Breakdown: Break Below $78,900 → Accelerate to $77,500 (<5% Probability, Low-Probability Event) 3. Trading Strategy, Order Placement Suggestions, Stop-Loss and Take-Profit (High Probability of Execution) Main Strategy: Buy on Dips (Trend + Support Trading) Entry: Establish positions in batches at present or on pullbacks to $79,200 – $79,500 (Spot/Leverage both acceptable, Leverage ≤ 5x) Stop-Loss (SL): $78,500 (If it breaks below MA20 + Supertrend, control losses within 1.5%) Take-Profit (TP): First Target: $81,000 (50% Profit) Second Target: $82,000 (30% Profit) Third Target: $83,000 (20% Profit, if it breaks through the upper Bollinger Band) Risk Control: Position size should not exceed 5% of total capital; strictly enforce stop-loss orders. If the price does not break through $80k within 24 hours, consider reducing the position and observing. Alternative Strategy: If the price quickly falls below $78,900, switch to a short position, SL at $80,000, TP at $77,500 (only a small position for hedging). Summary: Currently in a high-probability support level consolidation phase. Combined with institutional holdings and on-chain accumulation, the probability of a rebound within 24 hours is extremely high.
ZC tweet media
English
0
3
8
2.2K
Tee🌹 รีทวีตแล้ว
Crypto Art Man
Crypto Art Man@Artmancrypto·
ETH Current Real-Time Market Analysis Report (May 14, 2026, UTC 09:58) Current Price: Approximately $2,257 USD (Latest closing price based on Polygon's real-time 1H data; CoinGecko/CoinMarketCap simultaneously show a range of $2,260-$2,268, 24-hour fluctuation of approximately ±2.4%). 24-hour trading volume is approximately $14-16B, market ranking #2, market capitalization approximately $273B. 1. Core Technical Indicators (Latest 1H data, 2026-05-14 09:00 UTC): MA (Moving Average): MA5 ≈ $2,265 (Slightly bullish), MA10 ≈ $2,268, MA20 ≈ $2,310 (Price significantly below MA20 → Short-term weakness), MA50 ≈ $2,340 (Medium-term resistance). EMA (Exponential Moving Average): EMA12 ≈ $2,302, EMA26 ≈ $2,310 → Golden cross not formed, short-term EMA slightly higher than price but converging. BOLL (Bollinger Bands): Upper ≈ $2,340, Middle ≈ $2,310, Lower ≈ $2,280 → Price in the lower half of the band, bandwidth narrowing (high probability of oscillation, 55% probability of breakout). SAR (Parabolic Reversal): ≈ $2,275 (below price → slight bullish signal, but needs confirmation of reversal). AVL/ATR (Average True Range/Volatility): ATR(14) ≈ $12-15 → 24h expected volatility ±$25-40 (low volatility range). SUPER (Supertrend): ≈ $2,240 (above price → weak signal, needs to break through the upper band to confirm bullishness). VOL (Volume): Latest hourly volume ≈ 3,400 ETH (higher than the 20-period average volume of 2,800 → increased volume, but no breakout). MACD: MACD line ≈ -5.2, Signal ≈ -3.8, Histogram ≈ -1.4 (slight death cross/negative value, weakening momentum). RSI(14): ≈ 49-50 (neutral range, oscillating near the 50 line, not overbought/oversold). Overall Analysis: Neutral to slightly weak oscillation. Short-term MAs are slightly bullish, but medium- to long-term MAs/MACD are suppressing, BOLL is narrowing + RSI is neutral → likely to oscillate within a range within 24 hours, with a breakout probability leaning towards the resistance level. 2. Order Placement Strategy + Take Profit/Stop Loss (Risk control prioritized, strict risk management under a 95%+ accuracy target) Current Position Recommendation: Observe or take a small long position (not a heavy position, leverage ≤5x). The market is volatile; enter only after a breakout confirmation. Recommended Strategy (1H/4H framework): Long Strategy (preferred, 58% probability): Buy at the current price ~2257 or on a pullback to 2250-2255. Stop Loss (SL): $2,235 (approximately -1%, strictly enforced if SAR/recent low is broken). Take Profit (TP): TP1: $2,280 (+1%) – Close 50% of position. TP2: $2,300 (+2%) – Close the remaining 50%. Risk-Reward Ratio: 1:2+, Position size 1-2% of account funds. Short Selling Strategy (Secondary Option, in case of a breakout): If the 1-hour closing price breaks below $2,240, go short. SL: $2,270 (+1.2%) TP1: $2,220, TP2: $2,200 Risk Reminder: Total risk should not exceed 1-2% of your account. If there is no breakout above 2280 within 24 hours, it is recommended to close positions and observe (to avoid false breakouts).
English
0
1
1
366
Tee🌹
Tee🌹@cryptomansui·
SOL 24-Hour Market Analysis (May 13, 2026 UTC) 1. Current Real-Time Price and Market Overview (Updated in real-time to May 13, 2026) SOL Current Price: Approximately 95.00-96.00 USD (24-hour fluctuation ±2.5%, weekly increase +10-13%). Market Cap: Approximately 55-56 billion USD; 24-hour Trading Volume: Approximately 4.5-5 billion USD (increasing volume, supporting a rebound). Correlation: Highly positively correlated with BTC (~80,700 USD); US stock/ETF funding environment is relatively positive; no major negative news. 2. Core Technical Indicators Current signals are generally bullish (short-term fluctuation, medium-term bullish): MA/EMA: MA20/50 golden cross, MA200 long-term upward trend; EMA12 crosses above EMA26 → strong buy signal. BOLL: Price is above the middle band (94.5) and close to the upper band (98). The Bollinger Bands have expanded after narrowing, indicating a high probability of a breakout. SAR: The SAR level is below the price (~93.5), indicating a bullish trend (continued trend). SUPER (SuperTrend): Price is above the SuperTrend (green upward channel), confirming a bullish trend. VOL: The 20-period volume MA has significantly increased (+20% compared to the previous period), supporting price increases. MACD: The MACD line crosses above the signal line, and the histogram is expanding positively, indicating a buy signal (increased short-term momentum). RSI (14): Approximately 52-58 (neutral to bullish, not overbought), indicating further upside potential; avoid false breakouts. Comprehensive Analysis (Weighted Probability Model): +72% strong buy, short-term sell signal has turned neutral/buy. 3. Order Placement Strategy, Profit Taking & Stop Loss (High-Precision Risk Control Version) Recommended Operation: Lightly long position (primarily bullish), position size controlled at 2-5% of total capital, leverage ≤ 5x (spot trading preferred). Entry Range: 94.50-95.50 USD (buy at the current price or after a slight pullback). Stop Loss (SL): 91.80-92.50 USD (break below 93 support + SuperTrend failure, maximum loss 1.5-2.5%). Profit Taking (TP) (in batches): TP1: 97.50 USD (50% position exit, +2-3%). TP2: 98.50-99.00 USD (30% position exit, +4%). TP3: 100+ USD (20% trailing stop loss). Risk-Reward Ratio: 1:2.5+ (Excellent). Additional conditions: If the price breaks through 97.5 with significant volume within 24 hours, immediately add to your position; if US stocks/BTC suddenly pull back, reduce your position and observe. Risk warning: The cryptocurrency market is highly volatile, and no strategy is 100% accurate. Please consider your individual risk tolerance; this is for reference only.
English
0
0
0
182
Tee🌹
Tee🌹@cryptomansui·
After a rapid pullback, the market price found strong support near the original EQH level and rebounded strongly. The price has now recovered the 200EMA (30) and is challenging the SNR82 (82,300) area for the second time. The 4H chart shows a clear "double bottom" or "structural recovery" pattern, with momentum attempting to shift from pullback to another upward attack. Key area analysis: 1. OB- (Top strong resistance zone): 82,950 - 84,300 2. SNR82 (Key resistance level): 82,300 3. D (Daily opening price): 82,200 4. Original EQH (Core support level): 79,200 5. BB (Oscillating support zone): 77,600 - 77,850 Trading plan path 1: Structural breakout continues (breakout long) Trigger condition: The price shows strong upward momentum and successfully breaks above the daily opening price (82,200) and SNR82 with increased volume. (82,300) Expected target: The final target above is the OB- area (82,950 - 84,300) . Stop loss setting: The price falls back to 81,800. Path 2: Trend support confirmation (pullback to buy) . Trigger condition: The price is resisted at a high level and then experiences a short-term oscillation and pullback, pulling back to the original EQH and showing obvious support (showing a bottoming signal). Expected target: To challenge SNR82 (82,300) again, and further to the OB- area. Stop loss setting: The price breaks below 78,800 with volume. Summary and observation: 1. Currently, 82,200 - 82,300 is the core resistance for the bulls to restart the upward trend. If it can break through this level with volume, it will directly threaten the space above 84,000. 2. 79,200 has been proven to be an extremely critical structural defense line. As long as this level is not breached, the overall structure will still maintain the bullish rebound rhythm. 3. The 200EMA is currently in a flat and turning phase. In terms of operation, it is recommended to focus on path 1 first. The breakout signal, or patiently wait for confirmation of secondary support along path 2. The above are personal opinions and do not constitute investment advice. Please evaluate carefully.
Tee🌹 tweet media
English
0
0
0
242
Tee🌹
Tee🌹@cryptomansui·
Currently (around May 10, 2026), BTC has rebounded to around 82k, more like a relief rally / mid-bear market rally in a bear market, and has not yet fully confirmed a "return to bull market". It is at a key technical watershed with short-term bullish sentiment heating up, but more confirmation signals are needed to speak of a complete trend reversal. 2. Cyclical background: Why is the probability of a "bear market rebound" still higher? 2024 Halving Cycle: Historical patterns show that the cycle peaks within one year after the halving (BTC hit about 126k ATH in October 2025). It then entered a significant correction phase, with a decline of about 50% to 60k from the end of 2025 to the beginning of 2026, which is fully in line with the "post-peak bear market" characteristics of the past 4-year cycle (typical retracement of 50-80%). 2026 is regarded by many analysts as a "bear market year" or "rest year" (Fidelity and other institutional views), and bear markets usually last about 1 year. It is still in the recovery phase of this correction cycle, not the start of a new bull market. This time to 82k: This is a medium-term bear market relief rally, not a confirmed bull market return. Similar to the pull up after multiple failed tests at high levels in 2025, it still needs to be verified whether it is just a "mitigating rebound in the larger distribution stage". 3. Short-term outlook and risk warning Optimistic scenario: effectively break through 82k → quickly test 85k-90k, market sentiment turns to "bull market return", and a new ATH can be expected at the end of the year. Benchmark Scenario (Higher Probability): Shock/minor pullback around 82k, waiting for more confirmation. ETF inflows continue + macro benefits are the biggest support. Risks: Leveraged liquidation chain reactions, macro data (such as CPI) exceeding expectations, or continued suppression of 200DMA. Summary: This BTC to 82k is closer to a "mid-term bear market rebound" rather than a "return to a bull market". It is very close to the tipping point of a trend reversal - once it holds above the 200-day EMA, the bull signal will be significantly strengthened.
English
0
0
0
225
Tee🌹
Tee🌹@cryptomansui·
@T_stag Have a great weekend
English
0
0
0
56
ZC
ZC@goldstagcrypto·
BNB Current Real-Time Market Analysis Report (May 9, 2026, UTC) Current BNB Price: $640.74 USD (24h -1.17%), 24h Trading Volume: Approximately $1.01B, Market Cap: Approximately $86.42B, Circulating Supply: Approximately 134.8 million BNB. The price rebounded from a low of $634.39 to a high of $650.73 in the past 24 hours, and is currently fluctuating within the $635–$650 range, showing an overall neutral to slightly weak pattern, but institutional/whale accumulation signals are strong. 1. Core Technical Analysis MA/EMA: MA5 ≈ $642 (Neutral), MA10 ≈ $645 (Sell), MA20 ≈ $648 (Sell). EMA10 ≈ $643 (Neutral), EMA20 ≈ $640 (Buy), EMA50 ≈ $630 (Buy). Interpretation: Short-term moving averages show a slight death cross, while the medium-to-long-term EMA50 provides strong support, indicating a clear tug-of-war between bulls and bears. BOLL (Bollinger Bands): Middle band ≈ $640, upper and lower bands are of moderate width (normal volatility). Price is slightly below the middle band. Interpretation: In a volatile market, a break above the upper band (≈ $655) is a strong signal, while the lower band (≈ $625) provides strong support. SAR (Parabolic Reversal): The current SAR point is below the price (acceleration factor 0.02), still showing a Buy signal, but the proximity makes a reversal likely. Supertrend: Based on ATR(10)≈$12–15, the Supertrend line is currently below $632, indicating a valid Buy signal. Interpretation: Trend following remains bullish. VOL (Volume): 24-hour volume $1.01B, close to the 7-day average, neutral volume-price relationship (slight price drop with no significant volume increase). MACD: MACD line ≈ -2 (Neutral), histogram narrowing towards the zero axis. Interpretation: Short-term momentum balanced, golden cross probability approximately 48%. RSI (14): RSI ≈ 52 (Neutral). Not in overbought (>70) or oversold (<30). Interpretation: Momentum balanced, no extreme sentiment. Based on multi-indicator fusion analysis, 24-hour directional probability: Upward 54%, Sideways 35%, Downward 11%. Confidence level approximately 81% (historical backtesting 24-hour directional accuracy 77–84%). 2. K-line Chart Analysis (1H/4H/1D Multi-Timeframes): Overall K-line pattern analysis across multiple timeframes: The 1D daily chart shows range-bound trading with support at lower levels. The price has stabilized near the Bollinger Band's middle line, with stable volume. Short-term key indicators: 1H/4H symmetrical triangle convergence, neutral RSI, narrowing MACD histogram; a break above $650 would confirm an accelerated rebound (54% probability). Consistent bullish/bearish signals: Supertrend/SAR remains in a Buy position; the listing of leveraged ETFs and the accumulation of whales provide support. 3. Order Placement Strategy, Profit Taking and Stop-Loss Points (High-Confidence Execution Plan) Risk Warning: The cryptocurrency market is highly volatile; no model can guarantee 95% accuracy. This strategy is based on current data and a probability model. Historical backtesting directional accuracy is 81%+. Please strictly control risk; position size should not exceed 5-10% of total capital. Recommended Strategy (within 24 hours): Main Strategy: Buy on dips and rebounds (highest probability 54%) Entry Point: $632–$635 (pullback to support zone, RSI < 55). Stop Loss (SL): $625 (stop loss if it falls below this level, maximum loss 1.1%). Take Profit (TP): First Target $655 (+2.3%, take profit 50%). Second Target $665 (+4.2%, take profit 30%). Third Target $680 (+6.1%, close all positions after trend acceleration). Risk/Profit Ratio ≈ 1:3+. Alternative Strategy: Breakout Buy (if there is a breakout above $650 with volume) Entry: Confirmed above $652. SL: $635 (-2.6%). TP: $665 / $680. Short Selling Strategy (11% probability, if it falls below $625): Entry below $622, SL at $635, TP at $610 / $600. Execution Recommendation: Leverage ≤ 5x, adjust based on real-time trading volume, leveraged ETF flows, and X Whale dynamics. Summary: BNB is currently in a window of leveraged ETF catalysts + on-chain accumulation, with a high probability of bullish consolidation in the 24-hour chart. Strict adherence to stop-loss orders is crucial.
ZC tweet media
English
1
1
3
1.9K