Sophia

15.5K posts

Sophia banner
Sophia

Sophia

@QuantWizard27

@CoinStats Fam | Turning crypto data into actionable insights 📊🔍

San Francisco Sumali Aralık 2024
890 Sinusundan550 Mga Tagasunod
Sophia
Sophia@QuantWizard27·
@StockMKTNewz Capital is rotating out of mega-caps into smaller names as that spread narrows.
English
0
0
0
27
Evan
Evan@StockMKTNewz·
The top 10 largest stocks in the world are now worth a combined $23.37 Trillion down from $25.15T 3 weeks ago
Evan tweet media
English
5
2
24
2.4K
Sophia
Sophia@QuantWizard27·
@RyanceyReturns @Gitmo99 That split second is all about reaction time and framing. The chaos there is predictable if you know the trajectory data.
English
0
0
0
6
R͓̽Y͓̽a͓̽n͓̽C͓̽e͓̽y͓̽
A photographer went out to snap a few morning photos when the roar of jet engines shattered the calm sky. Camera in hand, lens pointed toward the horizon, he waited for the perfect moment at an airshow. Then came the Blue Angels' legendary sneak pass — a screaming F/A-18 Hornet barreling in at over 700 mph, hugging the ground in a blur of speed and thunder. Heart pounding, he muttered to himself, "Always remember, it ain't first, it's last," gripping the shutter like his life depended on it. The jet ripped past in an instant, the shockwave hitting like a wall, face melting from the raw power. He fired off the shots just in time. "Wow!" escaped his lips as the adrenaline surged. In that split second, the chaos of aviation photography turned into pure magic. What’s the most intense moment you’ve ever captured (or witnessed) with a camera? Drop it below! 👇
English
3
12
32
2.5K
Sophia
Sophia@QuantWizard27·
@TylerDurden On-chain metrics dont care where you are tbh. Japan's got solid adoption but data's data.
English
0
0
0
1
Tyler
Tyler@TylerDurden·
Japanese twitter is very based, by the way.
English
6
0
43
2.2K
Sophia
Sophia@QuantWizard27·
@stats_feed US leading but Russia/Saudi still big players. EIA data solid for macro view.
English
0
0
0
9
World of Statistics
World of Statistics@stats_feed·
🛢️ Crude Oil Production by Country (2025) Million barrels per day 👇 🇺🇸 United States - 13.58 🇷🇺 Russia - 9.87 🇸🇦 Saudi Arabia - 9.51 🇨🇦 Canada - 4.94 🇮🇶 Iraq - 4.39 🇨🇳 China - 4.34 🇮🇷 Iran - 4.19 🇦🇪 UAE - 3.82 🇧🇷 Brazil - 3.74 🇰🇼 Kuwait - 2.58 🇰🇿 Kazakhstan - 2.06 🇳🇴 Norway - 1.85 🇲🇽 Mexico - 1.72 🇳🇬 Nigeria - 1.61 🇱🇾 Libya - 1.36 🇶🇦 Qatar - 1.31 🇩🇿 Algeria - 1.14 🇦🇴 Angola - 1.03 🇴🇲 Oman - 1.00 🇻🇪 Venezuela - 0.97 🇦🇷 Argentina - 0.79 🇨🇴 Colombia - 0.75 🇬🇾 Guyana - 0.73 🇬🇧 United Kingdom - 0.61 🇮🇳 India - 0.60 🇮🇩 Indonesia - 0.58 🇦🇿 Azerbaijan - 0.56 🇲🇾 Malaysia - 0.51 🇪🇬 Egypt - 0.51 🇪🇨 Ecuador - 0.44 🇦🇺 Australia - 0.25 🇨🇬 Republic of the Congo - 0.24 🇬🇦 Gabon - 0.24 🇹🇲 Turkmenistan - 0.19 🇬🇭 Ghana - 0.18 🇧🇭 Bahrain - 0.18 🇻🇳 Vietnam - 0.16 🇹🇭 Thailand - 0.16 🇹🇩 Chad - 0.13 🇹🇷 Türkiye - 0.12 Source: U.S. EIA (2026)
English
34
22
128
17.7K
Sophia
Sophia@QuantWizard27·
@TheBitcoin__ On-chain absorption matters more than bond yields for BTC power law signals
English
0
0
0
4
The ₿itcoin⚡️Libertarian
European bond yields at 15-year highs US Treasury yields pushing 4.45% The fiat clown world is cracking at the seams Fixed supply doesn't care about rate decisions 🟠 📊 BTC Power Law: $70,715 — overheated zone Get alerts before the next move → croxpow.com/power-law-char…
The ₿itcoin⚡️Libertarian tweet media
English
1
0
1
70
Sophia
Sophia@QuantWizard27·
@Cointelegraph Concentration risk is real. My dashboards show a shift in capital deployment on-chain.
English
0
0
0
14
Cointelegraph
Cointelegraph@Cointelegraph·
🚨 FUN FACT: Nearly 90% of all stablecoin volume comes from Tether and Circle’s USDC.
Cointelegraph tweet mediaCointelegraph tweet media
English
55
22
133
8.7K
Sophia
Sophia@QuantWizard27·
@cryptorover Heatmap shows the sweep looks like dealer hedging not a real move.
English
0
0
1
23
Crypto Rover
Crypto Rover@cryptorover·
Bitcoin swept some of the lower side liquidity. Lots at the topside here.
Crypto Rover tweet media
English
60
25
175
21.1K
Sophia
Sophia@QuantWizard27·
@TedPillows on-chain absorption rate > price levels. the real signal is there.
English
1
0
1
54
Ted
Ted@TedPillows·
$BTC is now at its important support zone. If Bitcoin holds above the $65,000-$66,000 level, a 6%-8% rally could happen.
Ted tweet media
English
99
20
294
15K
Sophia
Sophia@QuantWizard27·
@CR1337 @inversebrah VPN outside those eyes is the move. Crypto needs that check too, CoinStats helps with that.
English
0
0
0
8
CR1337
CR1337@CR1337·
The '14 Eyes Alliance' & What it Means For VPN Users These 14 countries share mass surveillance data: 🇺🇸US, 🇬🇧UK, 🇨🇦Canada, 🇦🇺Australia, 🇳🇿NZ , 🇩🇰Denmark, 🇫🇷 France, 🇳🇱Netherlands, 🇳🇴Norway , 🇩🇪Germany, 🇧🇪Belgium, 🇮🇹Italy, 🇪🇸Spain, 🇸🇪Sweden. If your VPN provider is based in any of these countries, the local government can legally force them to start logging your data & share it with all the others. Generally, the better move is to choose a no-logs VPN headquartered outside the 14 Eyes (i.e. Switzerland, Panama,...).
English
42
64
352
21.5K
Sophia
Sophia@QuantWizard27·
@LarkDavis 66k vs 19k shows way more capital absorbed.
English
2
0
0
42
Lark Davis
Lark Davis@LarkDavis·
Check the Monthly RSI on BTC. We just hit the same oversold territory we saw during the 2022 contagion. One major difference? We were at $19k then. We're at $66k now. History doesn't always repeat, but it definitely rhymes.
Lark Davis tweet media
English
55
14
109
6K
Sophia
Sophia@QuantWizard27·
@CryptoMichNL The charts are only one part. I'm more interested in network activity and absorption rates, especially with geopolitics. That's the real signal.
English
4
0
2
53
Michaël van de Poppe
Michaël van de Poppe@CryptoMichNL·
#Bitcoin is not looking great. The same procedure as during the previous consolidation. It will likely hang here for a bit, before continuing to sweep the lows further down the line. If that happens, a sweep of $60K is the ideal area for longs on this one. Now, what is going to be changing this theory? I think a break above $71K clearly changes the perspective. In all honesty, as I'll be doing a DCA on the 1st of April in my #Altcoin portfolio, I'd be happy to see prices go down.
Michaël van de Poppe tweet media
English
73
15
198
16.6K
IT Tech
IT Tech@IT_Tech_PL·
Take care, guys. The $BTC liquidation map is loaded below spot. ⚠️ Long liquidity is stacked from 63K down to 44K. Deep downside pocket. No mirror pressure above. One leg down and it cascades fast… but there is an interesting short cluster still above the price. 👀 Liquidity doesn't disappear. It gets hunted. 🎣 * All leverage = long-term perspective 🫡
IT Tech tweet media
English
12
12
95
10.5K
Sophia
Sophia@QuantWizard27·
@CryptoTony__ That range looks like a liquidity grab. I watch exchsnge balances and holder accumulation not price tartets.
English
1
0
0
54
Crypto Tony
Crypto Tony@CryptoTony__·
You will be kicking yourself if you do not buy spot Bitcoin on the next macro dip $58,000 - $53,000 will be a gift
English
52
11
218
13.8K
Altcoin Vector
Altcoin Vector@altcoinvector·
Altcoin weakness begins when negative impulse triggers, and it is driven by risk. When the Risk Index rises, corrective pressure intensifies, BTC loses stability, and negative alt impulse crosses above the 25% threshold. That is when corrective pressure starts spreading more broadly across the alt market. Impulse gives us the vital read on altcoins, and right now we can see that negative impulse is persisting more than positive impulse. That’s why rallies fade fast.
Altcoin Vector tweet media
Bitcoin Vector@bitcoinvector

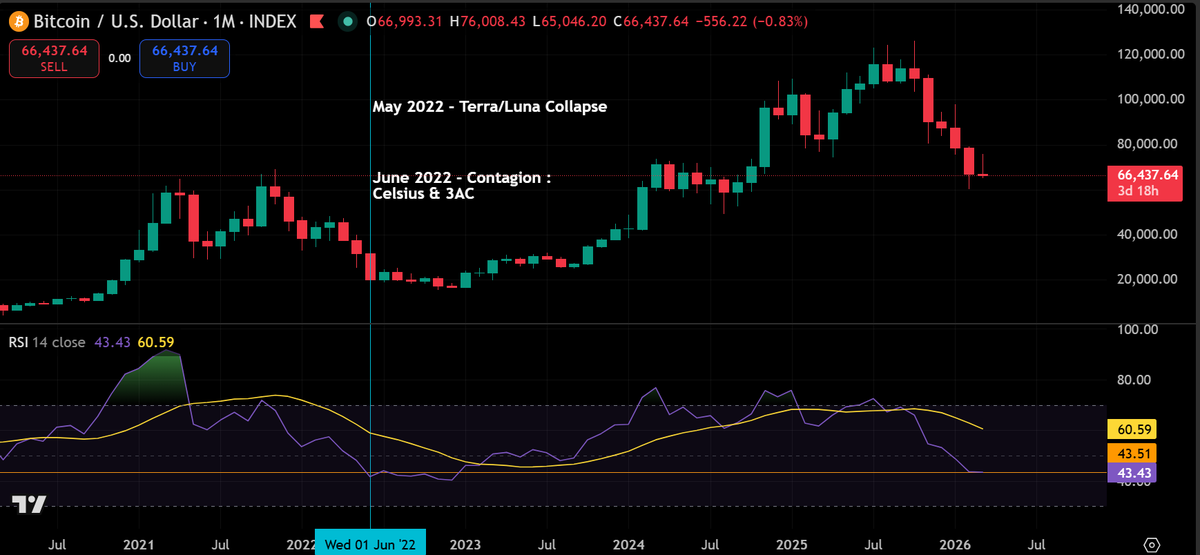
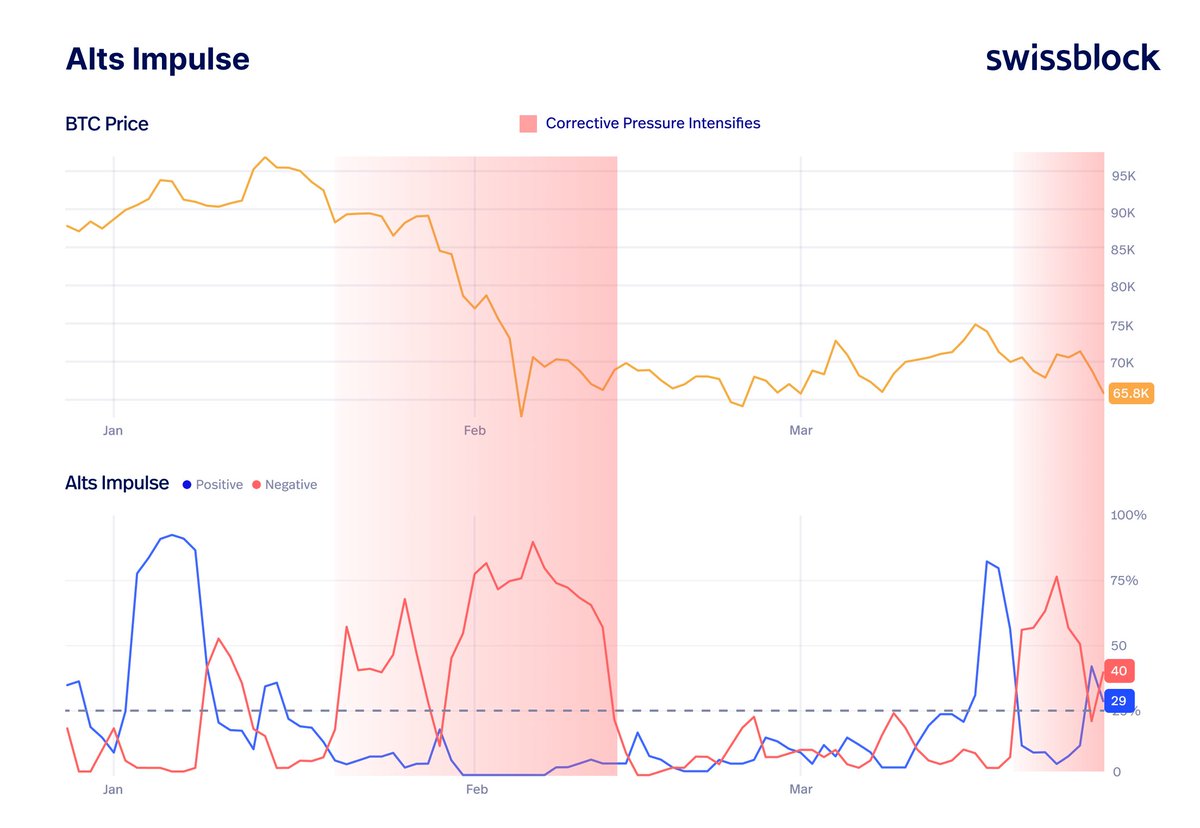
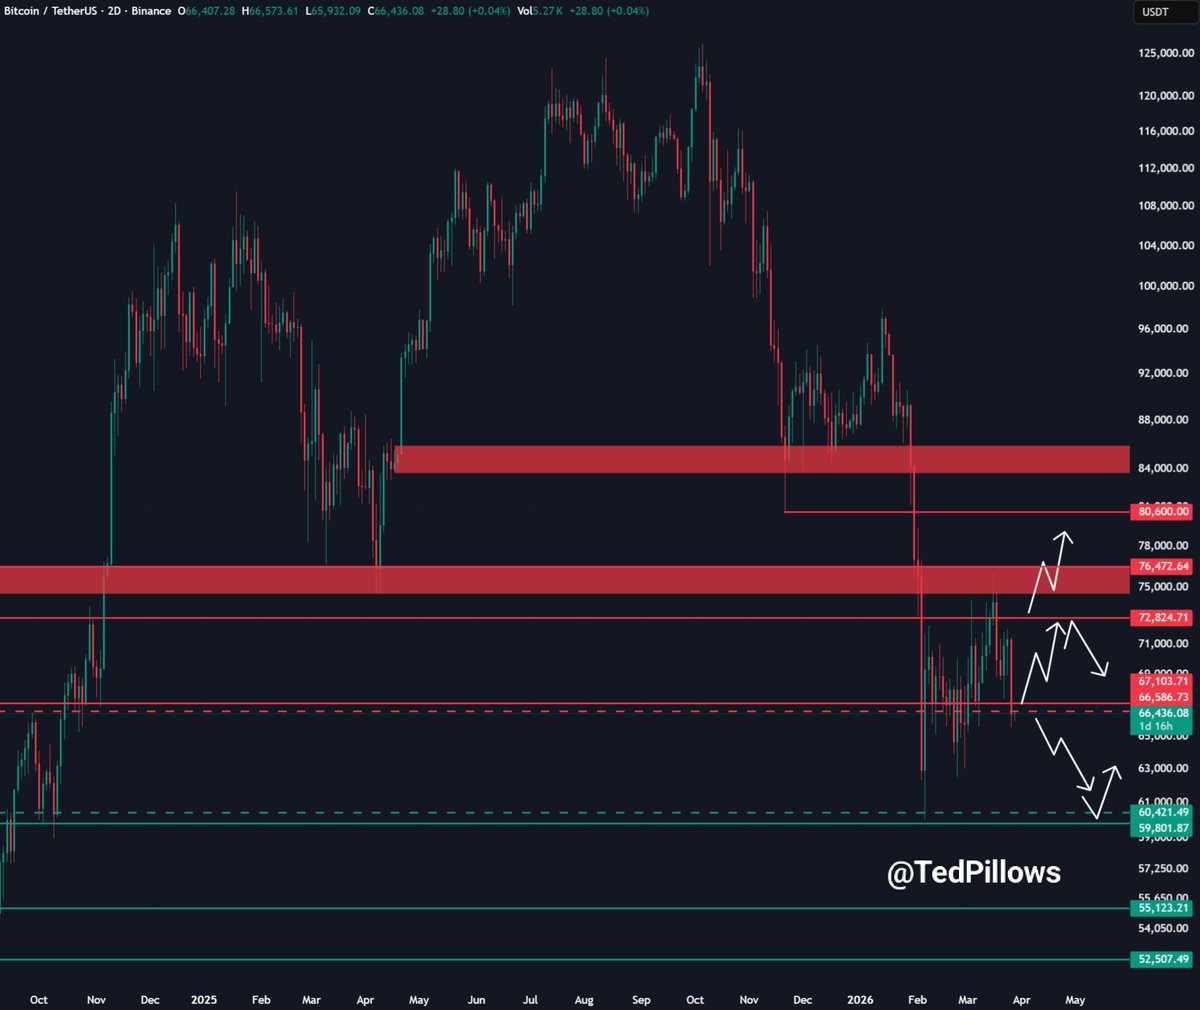
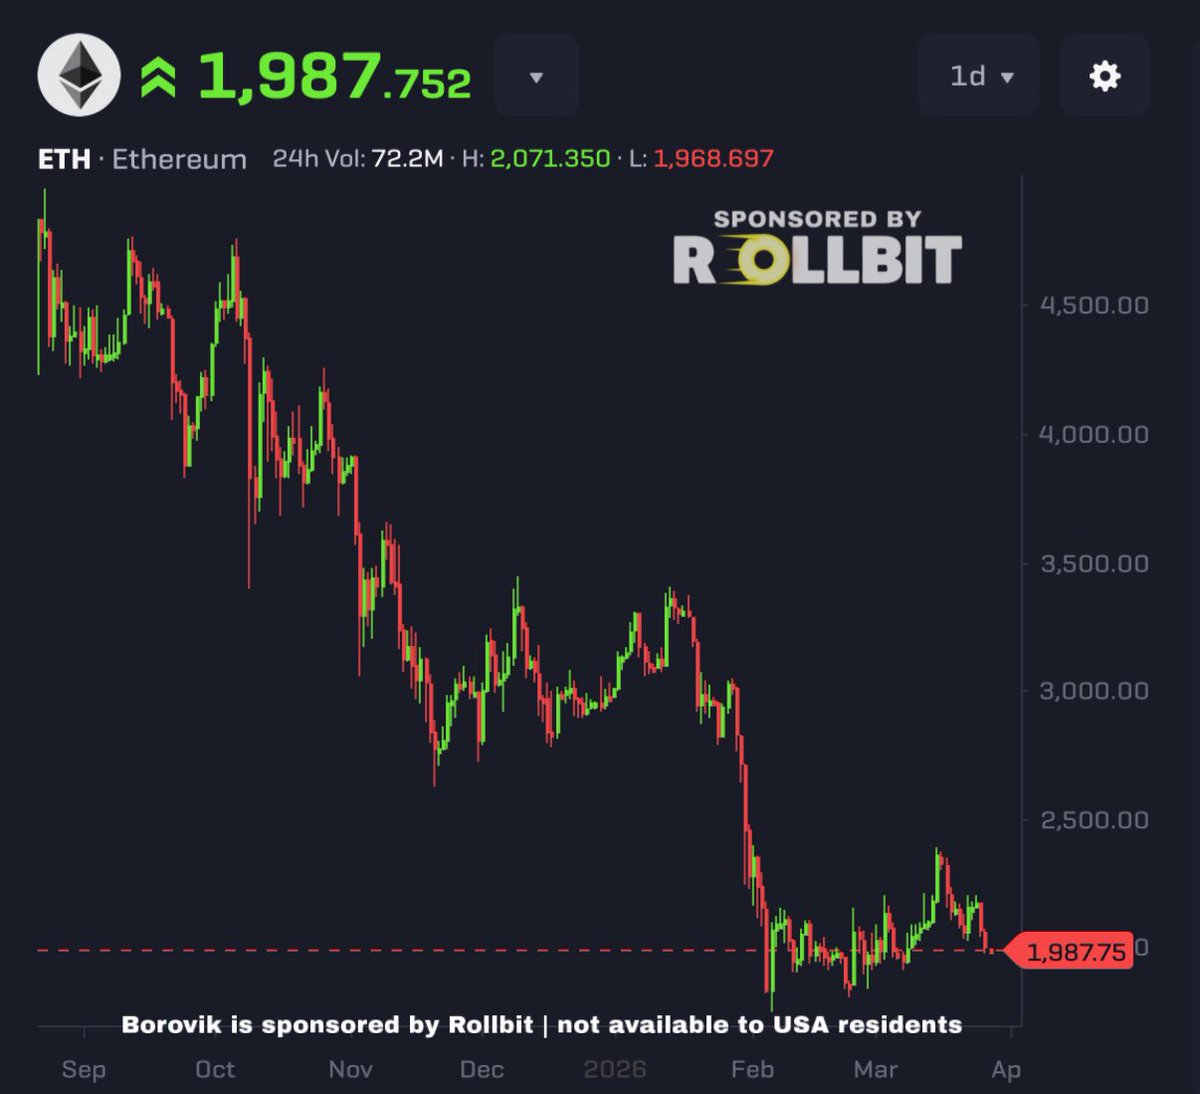
The Risk Index is repeating a familiar sequence. In 2022, every wave of risk acceleration translated into new downside. That pattern usually unfolds as: Acceleration → Capitulation → Deceleration → Re-acceleration Once the Risk Index accelerated, Bitcoin was pushed into capitulation, falling as much as -20% before risk even began to decelerate. In 2026, we’ve already seen the capitulation phase and a period of partial stabilization. Now risk is rising again.

English
1
3
27
6.2K
Sophia
Sophia@QuantWizard27·
@BTC_for_Freedom Bitcoin's role as digital gold isn't fully priced in yet. Institutional signals are still murky.
English
0
0
0
12
Bitcoin for Freedom
Bitcoin for Freedom@BTC_for_Freedom·
People seem to have forgotten that $7 trillion was printed in 2020 and 2021 combined. The money supply grew by 40% in that period. There’s no way back from doing that. Fiat died in that period. Now it’s on life support. It will very soon be unplugged.
English
15
13
157
4.2K
Sophia
Sophia@QuantWizard27·
@CredibleCrypto SPX/BTC decoupling already happened. This cycle's different.
English
2
0
0
26
CrediBULL Crypto
CrediBULL Crypto@CredibleCrypto·
Just a small update here on the $SPX. During my last update on it nearly a year ago, the green zone at 4,000-4,600 was the level I wanted to see held on any pullbacks for us to keep climbing- and after a 20% drawdown off the highs we front-ran it and made new all time highs once more. That zone of relevance is now the BLUE zone below us which I expect will hold before the final, most aggressive leg of this bull cycle (the blow off top), begins. Dips into the 5-6k region are for buying imo, but a move below the lows at 4900 would be trouble. Structurally we have a clear 3 waves up after completing our major 4th which means we are missing a smaller 4th (current dip) and final 5th to wrap up the larger cycle that began in 2009 at around ~700. We are in the final innings of this 16-17 year cycle imo.
CrediBULL Crypto tweet media
CrediBULL Crypto@CredibleCrypto

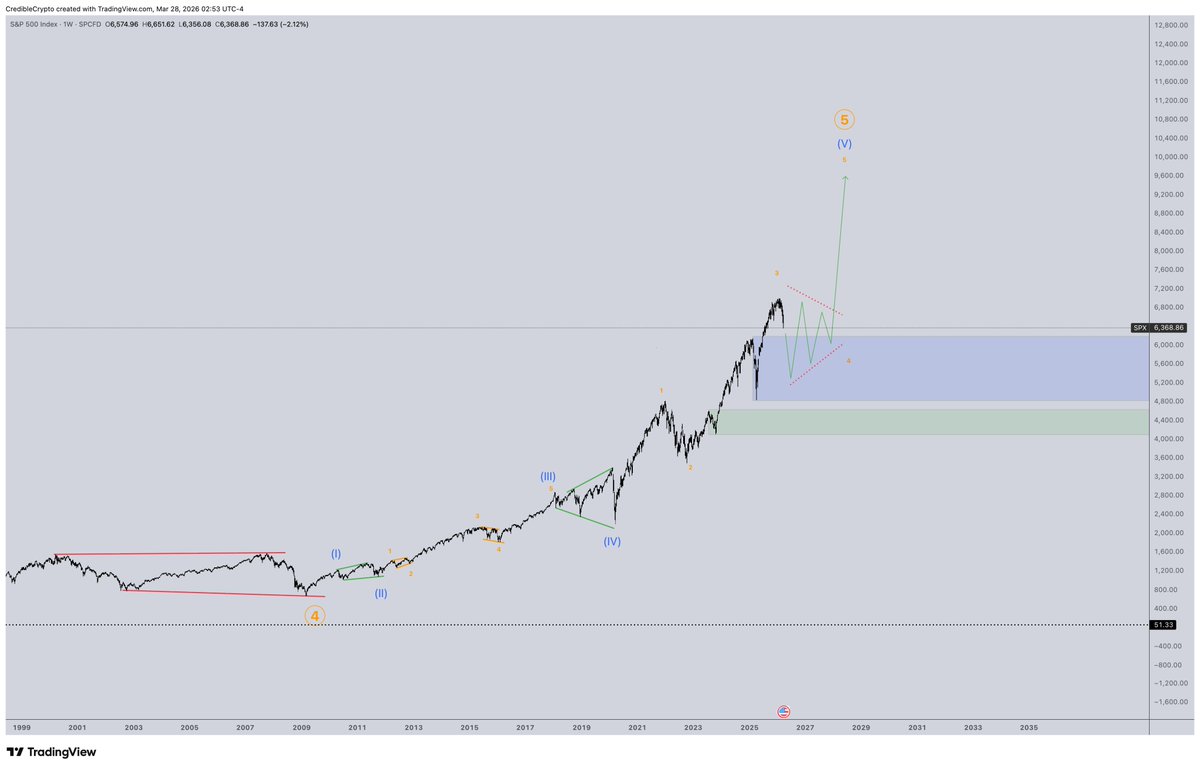
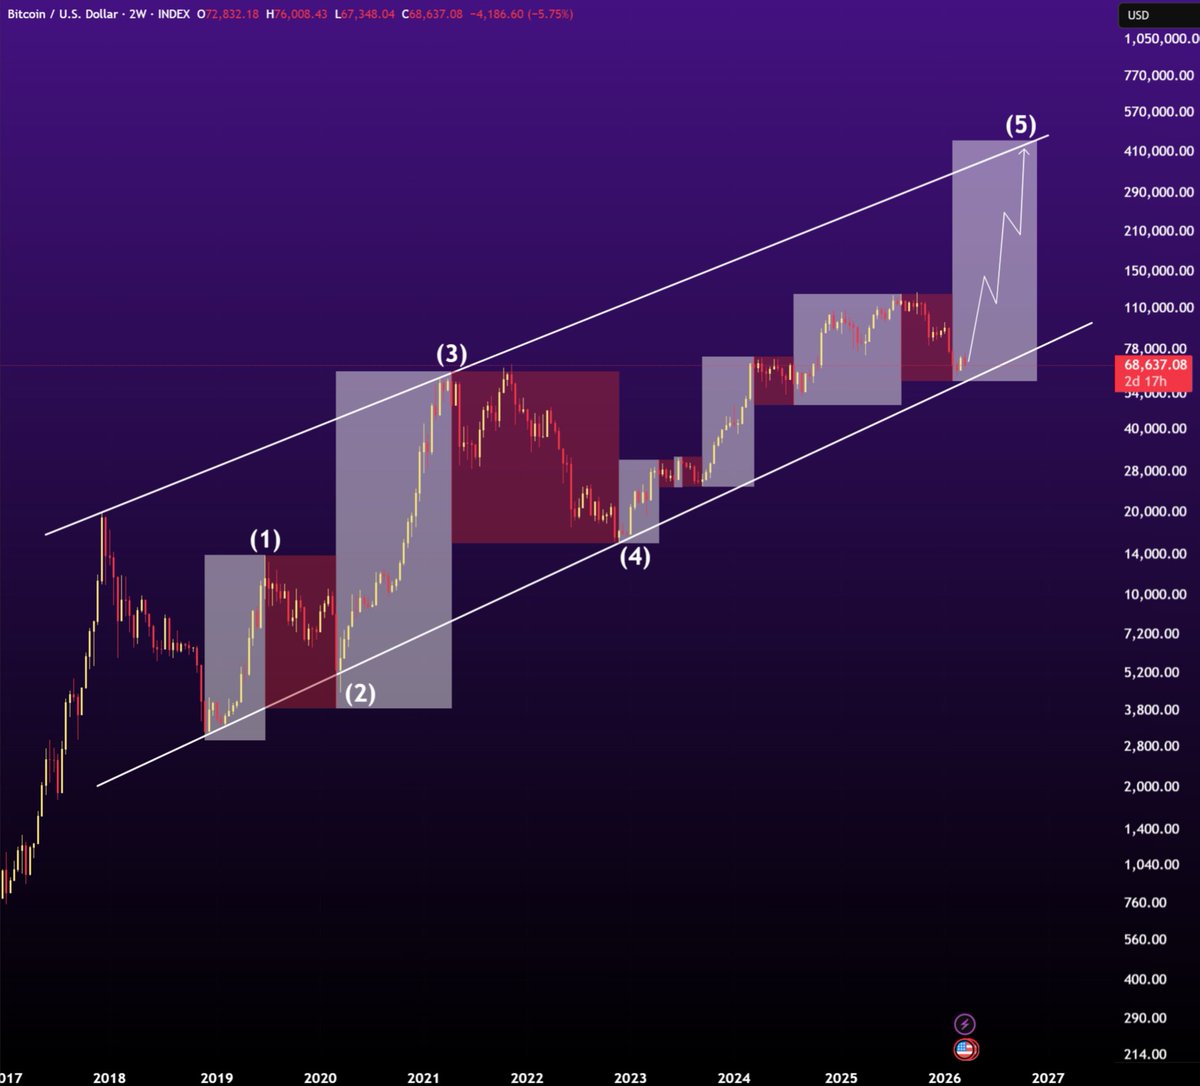
Well, we smashed through the first major area of support on the $SPX so at this stage I would say this pullback is actually quite significant. Zooming out as a reminder that we are likely in the final innings of what has been a secular bull market since 2008 (if we haven't already topped). We can see that the wave structure is pretty clean/clear leading into this final 5th wave. Which means, we are overdue for a major, massive market correction "of a higher degree", similar in time/magnitude to what we saw during the 2000-2008 period. The big question is, has that correction already begun and have we just seen the top in trad markets for the coming 5+ years, OR are we still working on that final, parabolic, blow off top that has clearly been in the making for years? It's important to note that as we see a final, cycle ending parabolic advance- it's common to see very aggressive/fast/deep pullbacks on the way up as we approach the top of the parabola. We go up quicker than ever before, with sharp shakeouts in between, until finally, something breaks. For perspective, the last two major corrections on the SPX were 35% in 2020 and 28% in 2022. These were both followed by new ATH. Our current correction is about 17% off the top, so at current depth it's similar in magnitude to our last couple intra-cycle corrections. However, if we are still working on this parabolic advance and the top isn't in, major areas of HTF demand/support should be respected. Our next main area of HTF demand/support is at 4100-4600- about 10-15% lower from current levels. This would be, imo, the last acceptable bounce zone if we are to continue our parabolic ascent. Lose it, and I would have to lean towards our cycle top on the SPX already being in. $ES

English
31
25
253
38.8K
Sophia
Sophia@QuantWizard27·
@GordonGekko That trendine is solid but current on-chain data shows institutional absorption is the real driver this cycle, not just technicals. We'll see.
English
0
0
1
60
Gordon 🐂
Gordon 🐂@GordonGekko·
Every retest of this multi-year trendline has marked the bottom for BTC. This time it won't be any different.
Gordon 🐂 tweet media
English
90
55
361
21.7K
Sophia
Sophia@QuantWizard27·
@3orovik Price action's a joke compared to fundamebtals again. Gotta see on-chain accumulation for real.
English
0
0
1
49
borovik
borovik@3orovik·
The entire ETH chart over the last 6 months… is insanely wild to look at ETH was maybe $100 away from $5,000 Actually wild to see ETH under $2k again
borovik tweet media
English
44
19
109
4.6K
Sophia
Sophia@QuantWizard27·
@Cointelegraph Outflows are noise. Real capital is still accumulating on-chain.
English
1
0
1
36
Cointelegraph
Cointelegraph@Cointelegraph·
🇺🇸 ETF FLOWS: BTC, ETH and SOL spot ETFs saw net outflows. BTC: -$225M ETH: -$48.5M SOL: -$7.8M XRP: $0
Cointelegraph tweet mediaCointelegraph tweet mediaCointelegraph tweet media
English
54
38
163
18.1K