MaybeTrading46

3K posts

MaybeTrading46

MaybeTrading46

@MaybeTrading46

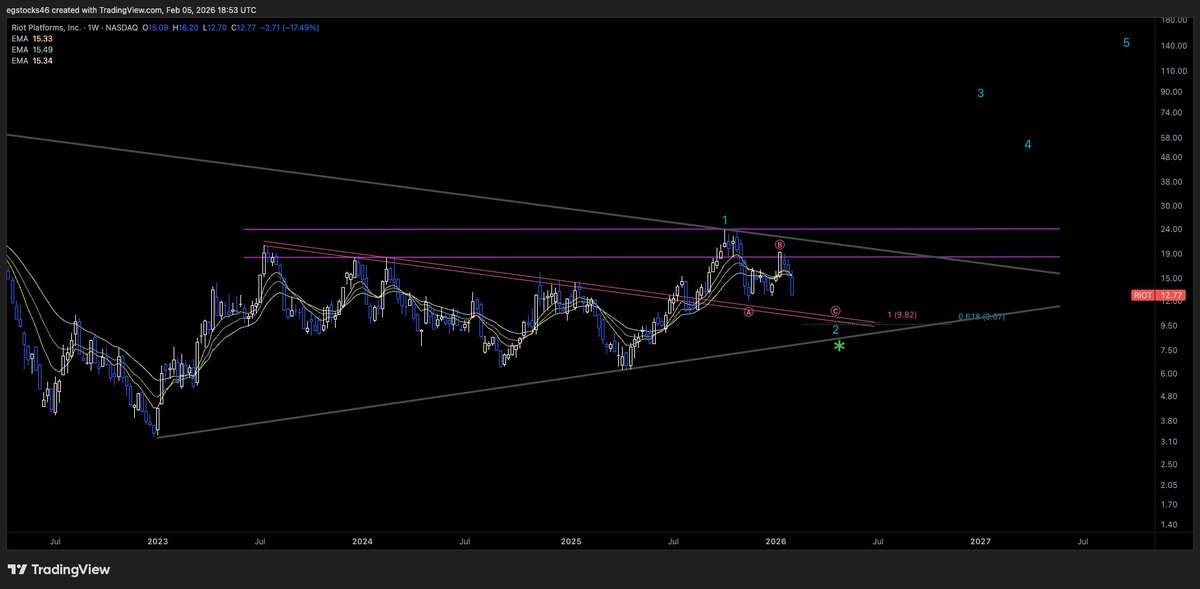
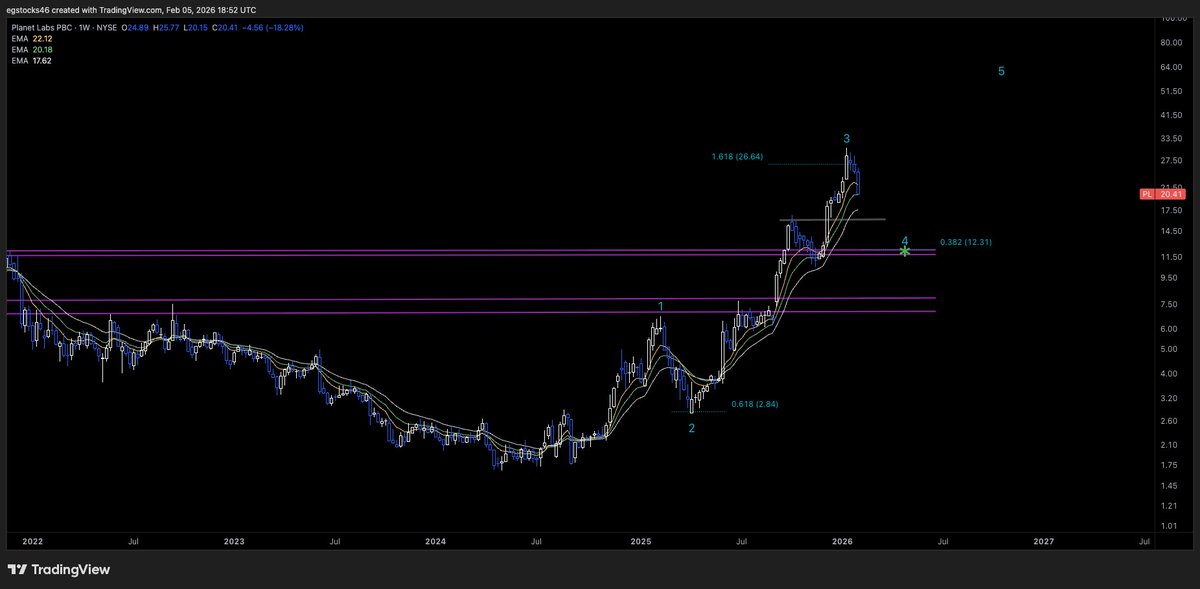
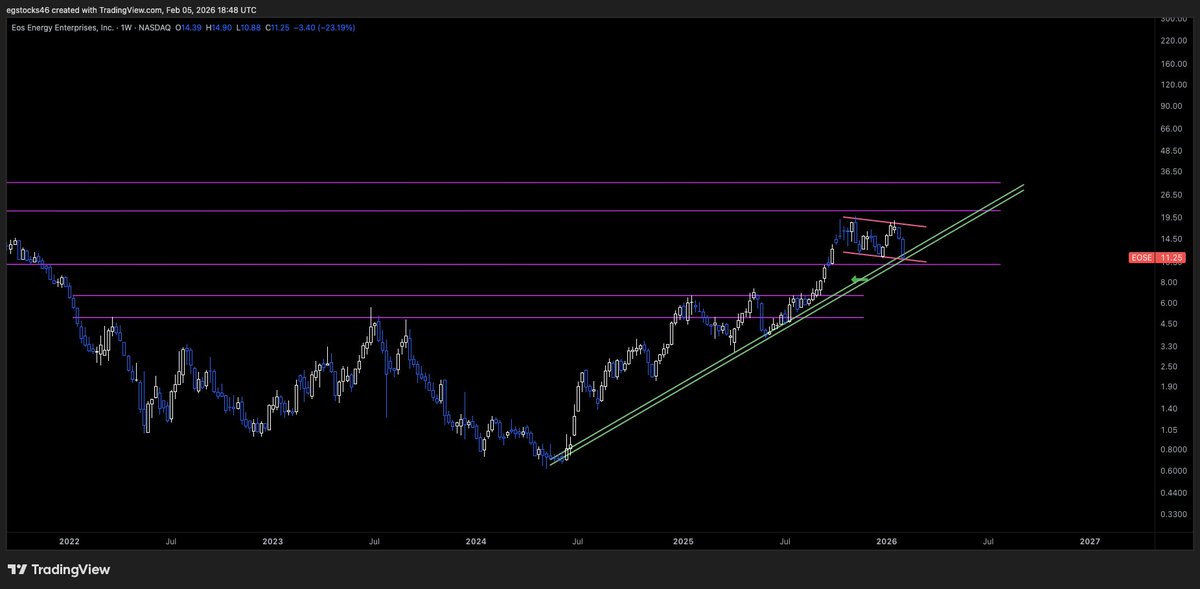
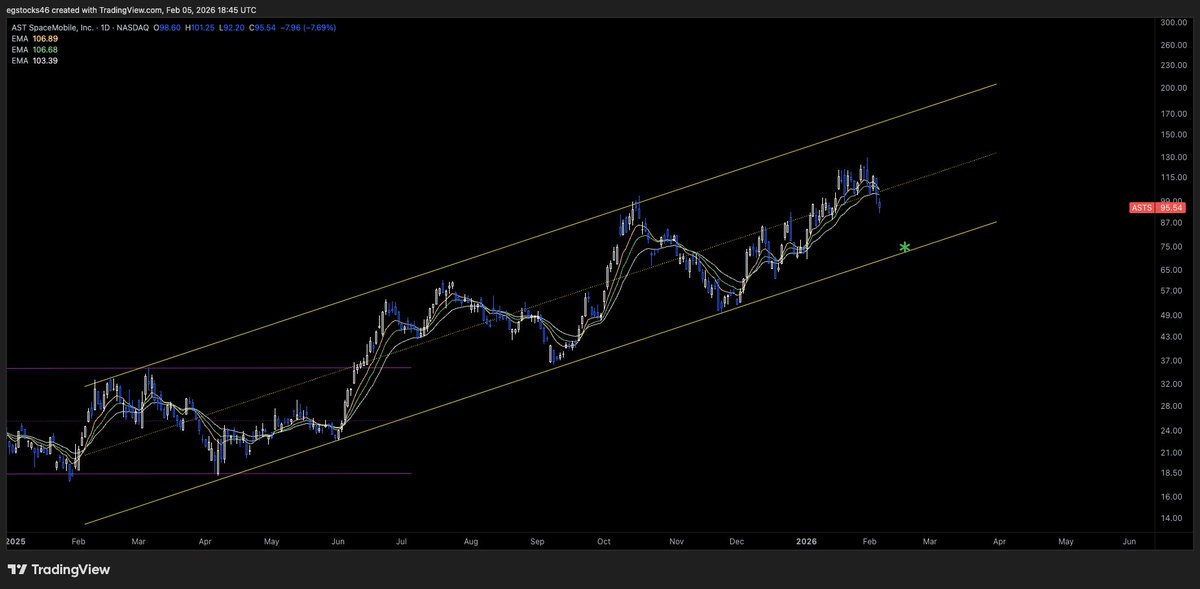
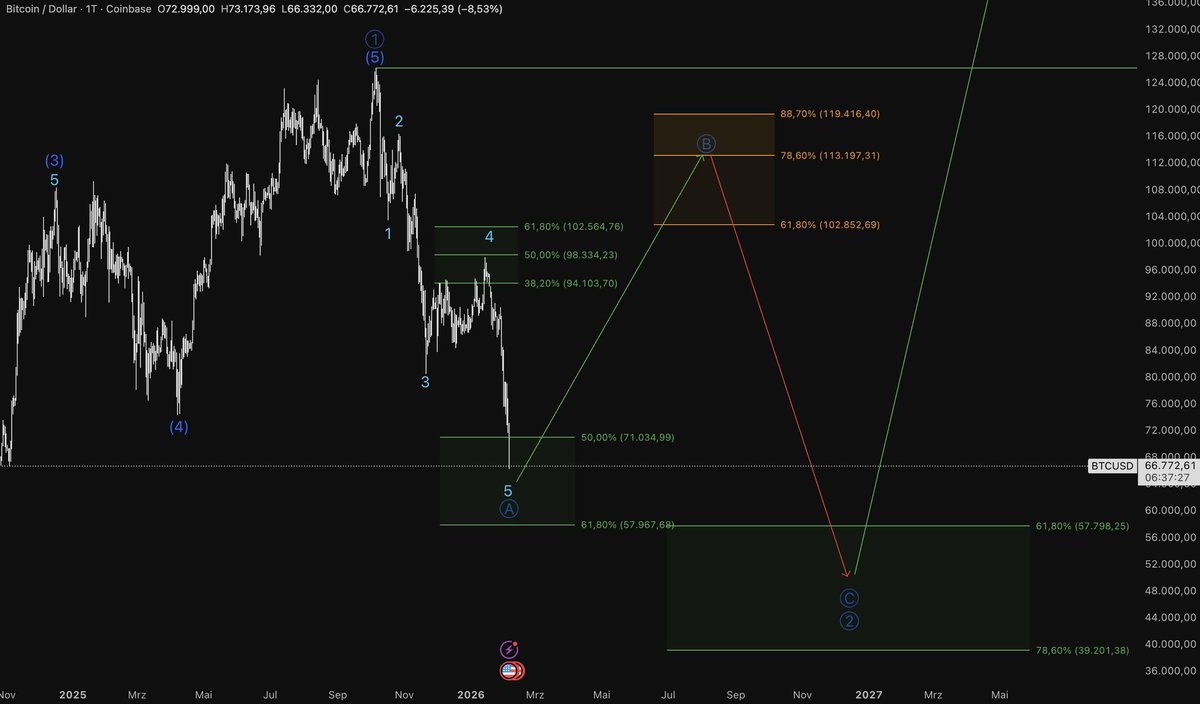
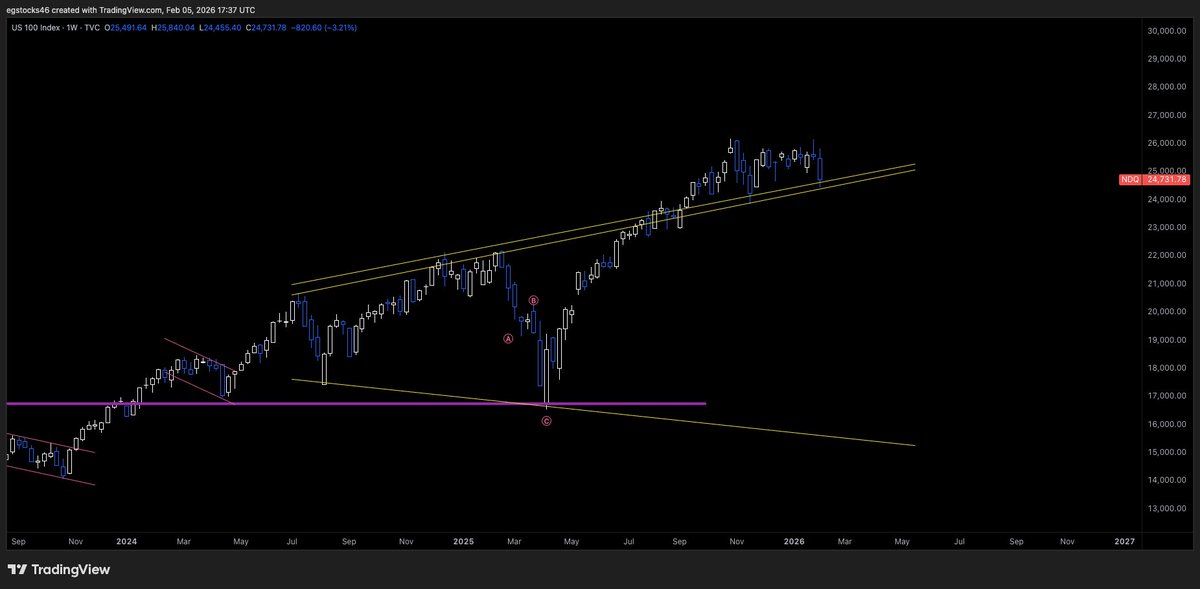
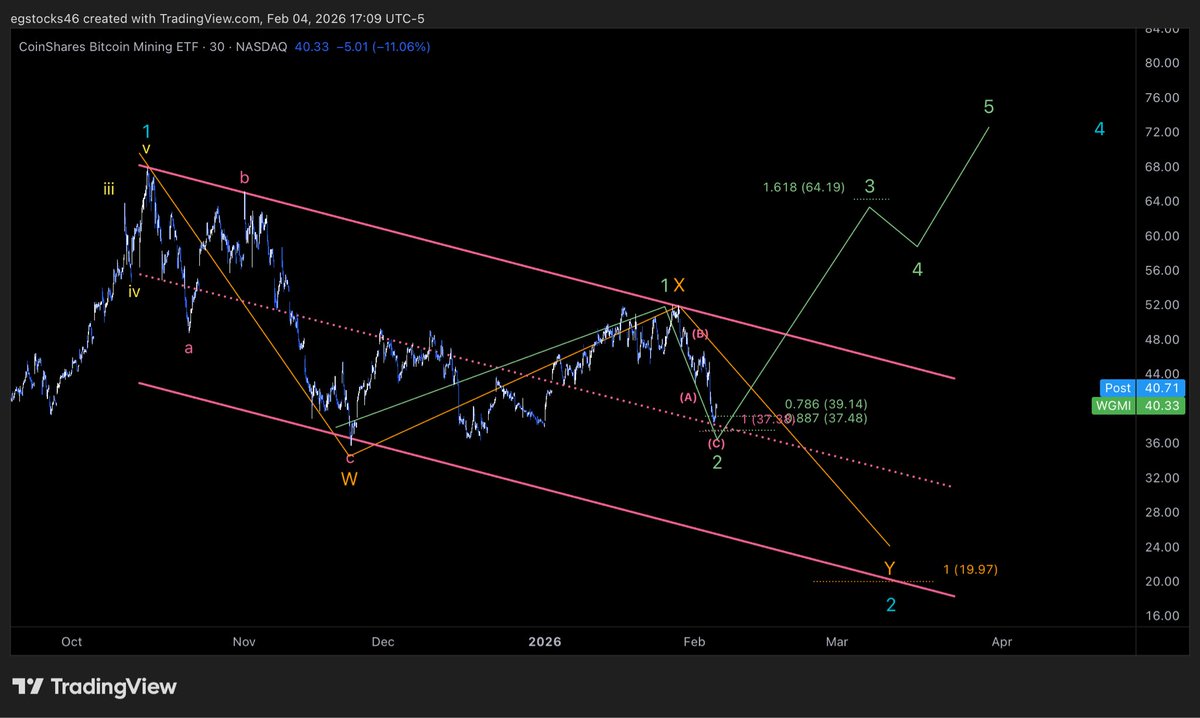
Posting charts as notes to myself... practicing EWT, Fibs and personality
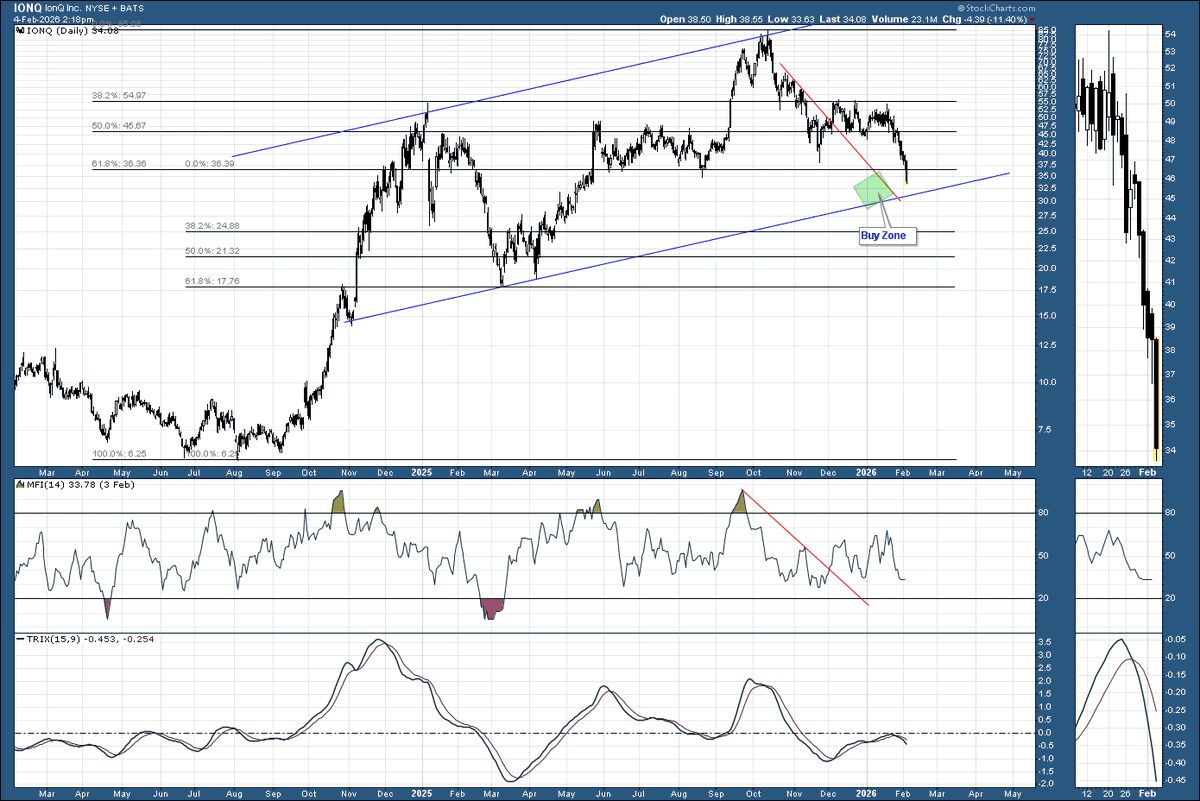
شامل ہوئے Kasım 2022
166 فالونگ645 فالوورز
MaybeTrading46
MaybeTrading46@MaybeTrading46·
@CSYvc My bad… I must have confused it with a post from someone else
English
1
0
0
55
CSYcapital
CSYcapital@CSYvc·
$NIO roadmap to $21$. We’re often asked when #NIO will reach $21... But first, I don’t want to create any FOMO here! It’s important to note that even after years of experience applying the #Elliottwave theory, it’s very difficult to predict when a wave will end. We are currently in Wave 3, which is the strongest wave. It can also extend, becoming even stronger and longer. If we look at Wave 1, it lasted 177 days. According to the literature, Wave 3 is said to be 1.618 times as long as Wave 1, so in this case, approximately 288 days in total. The peak would be exactly on July 17, 2026. I rarely use the trend-based Fibonacci time tool, as it isn’t always precise, but it helps as an additional guide. I must emphasize again that while it is possible, there is no 100% confirmation. If we look at the 2.618 level, we see the top at $21 around early 2027, which I perceive as more realistic. As the waves continue to develop and the chart picture becomes clearer, we will be able to provide you with more precise price and time estimates. 🫡
CSYcapital tweet media
English
9
8
136
8.7K
MaybeTrading46
MaybeTrading46@MaybeTrading46·
$BTC interested to see how this looks over the next 24-72 hours
MaybeTrading46 tweet media
English
0
0
1
154
MaybeTrading46
MaybeTrading46@MaybeTrading46·
@ChartWaveTrade I've been watching this potential WXY setup in $WGMI as a guide for potential downside. Agree that tomorrow looks particularly vulnerable.
MaybeTrading46 tweet media
English
0
0
0
140
Chart Wave Trading
Chart Wave Trading@ChartWaveTrade·
CPI before the open tomorrow with expectations at 2.5% The markets are very fragile currently and it is shown by strong earnings being met with stronger sell offs. A hot CPI print could trigger a sell off and break us from this diagonal triangle we are currently in on the $SPY chart And based purely off of volume profiles, we are expecting follow-thru from the sellers tomorrow.
English
2
1
4
2.2K
MaybeTrading46
MaybeTrading46@MaybeTrading46·
@StockTrader_Max If wave 5 completes as you've shown, waves 1,3,5 would all, more or less, be equivalent. That would be unusual. If we're in wave 5 as you're suggesting, I would expect it to significantly extend, resulting in wave 1=3, and 5 the longest. Any thoughts? $SPY
English
1
0
0
150
StockTrader_Max
StockTrader_Max@StockTrader_Max·
$SPY Still has a little higher to go... That being said, this 5 impulsive wave formation is slowly coming to an end and investors should show caution.. For now, the show goes on 📈
StockTrader_Max tweet media
English
3
2
23
3.5K
MaybeTrading46
MaybeTrading46@MaybeTrading46·
@Chartradamus Are you seeing this as a leading diagonal? I’m inclined to see IT more as a series of nested 1-2s. $IWM
English
1
0
1
102
Ch🅰️rtradamus 🔋
Ch🅰️rtradamus 🔋@Chartradamus·
$IWM Subwave 5 // Wave 3 PT= ~$290 🟢 Compared to $SPY and $QQQ, the Russell 2000 has remained relatively steady with a calm decline in the form of Subwave 4 these past couple weeks. I shared with you all that I found the $252-$256 range was the adequate retracement area and we obtained that exactly, coming between the .618 + .786 Fibs to retest the Daily 50MA as support. It is within reason now to believe that $IWM will continue its outperformance during this Wave 3 via Subwave 5 to reach the W3 1.618 Fib PT of ~$290, with the ability to extend towards the SW5 2.618 Fib PT of ~$300. This comes as $IWM has its Bollingers on the Monthly expanding to the upside, providing strong momentum higher for the next couple months, until we reach the Wave 3 targets. There is, however, a small chance that a broader market drawdown on $SPY $QQQ puts negative pressure on this, bring $IWM back down to retest the Daily 50MA or $252-$256 range as support.
Ch🅰️rtradamus 🔋 tweet media
English
1
0
18
1.6K
MaybeTrading46
MaybeTrading46@MaybeTrading46·
@TheWaveCount $BTC you may end up right, but the move down in $BTC looks much clearer as an equal lengths A=C correction
MaybeTrading46 tweet media
English
1
0
1
86
TheWaveCount
TheWaveCount@TheWaveCount·
$BTC update We’re currently in our trend reversal zone. As long as we keep dropping this aggressively, I won’t buy yet. That said, this zone does offer good buying opportunities. I expect a counter correction in Wave B soon, more precise target zones will follow. Not Financial Advice
TheWaveCount tweet media
English
1
0
4
1.3K
MaybeTrading46
MaybeTrading46@MaybeTrading46·
@Beyond_Charting Here's a different view... testing from above a trend line connecting previous tops. $NDQ
MaybeTrading46 tweet media
English
0
0
2
99
MaybeTrading46
MaybeTrading46@MaybeTrading46·
$WGMI green path up or orange path down? $IREN $HUT $RIOT
MaybeTrading46 tweet media
English
0
2
1
502
Beyond-Charting 📈
Beyond-Charting 📈@Beyond_Charting·
@MaybeTrading46 I can see a 5 Wave move up that is now correcting into an A-B-C down. Your target would not be terribly different than mine.
English
1
0
2
73