Jared Bernstein

361 posts

Jared Bernstein

Jared Bernstein

@econJaredB

شامل ہوئے Ocak 2025
367 فالونگ2.1K فالوورز
Jared Bernstein
Jared Bernstein@econJaredB·
@Brendan_Duke Re not backing off, I’m sure you’re right. But there’s a big difference between their specific tariff policies and the revs they’d raise with them, and the garbage numbers they write down re this rev source in their budget.
English
1
0
4
138
Brendan Duke
Brendan Duke@Brendan_Duke·
Trump's budget's revenue projections not only appear to ignore the Supreme Court ruling invalidating many of the tariffs--they exceed CBO's tariff projections made *before the SCOTUS decision.* Not just implausible but also a sign they may not back off on tariffs anytime soon.
Brendan Duke tweet media
English
5
13
34
5K
Jared Bernstein
Jared Bernstein@econJaredB·
Notable: Mid/low wage growth decelerating, as (headline) inflation rising. Real wage gains for this 80% of workforce were tracking >1%. Fcast for near term CPIs is closer to this current pace of wg growth, meaning < buying power. Hopefully short lived, but...wg stagflation.
Jared Bernstein tweet media
English
0
1
4
2.5K
Jared Bernstein
Jared Bernstein@econJaredB·
Job markets don't really shed 133K jobs in Feb only to add 178K in Mar. There's strikes (nurses out in Feb, back in Mar), sampling noise, etc. So you gotta run a smooth trend through the data. That last *trend* data point is ~30K, which is likely around, if not above, breakeven.
Jared Bernstein tweet media
English
0
1
6
356
Jared Bernstein
Jared Bernstein@econJaredB·
The folks at Wolfe Research (eg, @tobinmarcus) talk about reaching the strike price on the Trump put which leads him to TACO out of the war. Well, the @WSJ suggests it might be $4.02 on the gas price (though Trump's non-credibility means who knows?). wsj.com/world/middle-e…
Jared Bernstein tweet media
English
1
0
0
331
Jared Bernstein
Jared Bernstein@econJaredB·
@greg_ip @JonathanWeil Superb thread/article. But I'd like your take re whether risks worth the reward. I don't see it. Instead, I see "Minsky Moment" dynamics where risk is poorly understood/outside reg perimeter. Even w smaller magnitudes, low securitization, nervous abt where this is headed.
English
0
0
1
63
Greg Ip
Greg Ip@greg_ip·
@JonathanWeil 8/ The real threat, IMO: private credit is part of ubiquitous risk taking and speculation. Only when a shock (high oil prices?) puts the financial system under stress might the consequences of lax underwriting and risk management, and interconnections emerge.
English
2
3
25
4.5K
Greg Ip
Greg Ip@greg_ip·
As private credit's troubles mount, it's natural to wonder if it could lead to another financial crisis, as with subprime. I spent some time studying the parallels. Here's my answer. wsj.com/economy/is-ano…
Greg Ip tweet media
English
18
58
276
46.8K
Jared Bernstein
Jared Bernstein@econJaredB·
@mtkonczal Great stuff, as usual, Mike. Recession bars would show this is all pretty cyclical, no? Though take your and Noam's important points re relative changes. But part of it is just younger workers more vulnerable to weak labor markets.
English
0
0
0
70
Mike Konczal
Mike Konczal@mtkonczal·
Note the ratio increase starting around 2018 was driven by overall unemployment (denominator) falling below a still declining college-educated one. Unlike post-pandemic, where young is just increasing faster. Noam's story is excellent on how this feels for the people in it. 2/2
Mike Konczal tweet media
English
3
1
13
6.4K
Mike Konczal
Mike Konczal@mtkonczal·
By education, here's young (22-25, but similar for other ranges) unemployment rates divided by the total overall rate. Non-college is higher as a level but about what we'd expect given the slowdown. College has been converging higher post-pandemic and no clear story why. 1/2
Mike Konczal tweet media
Noam Scheiber@noamscheiber

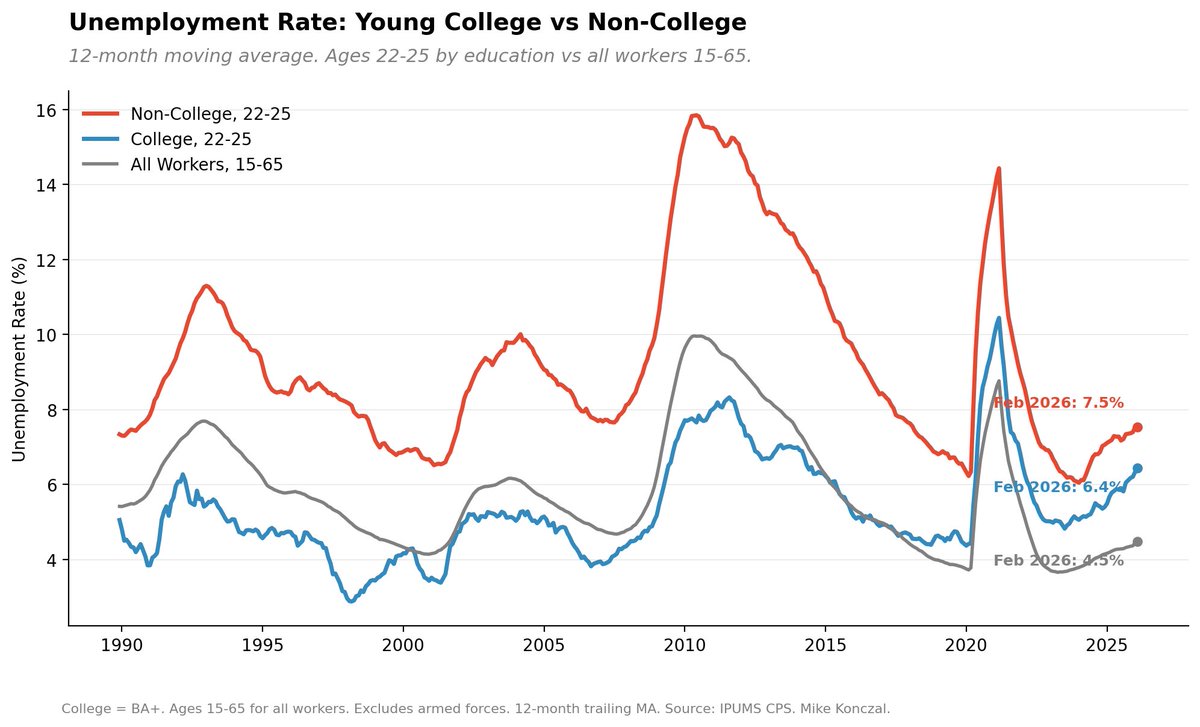
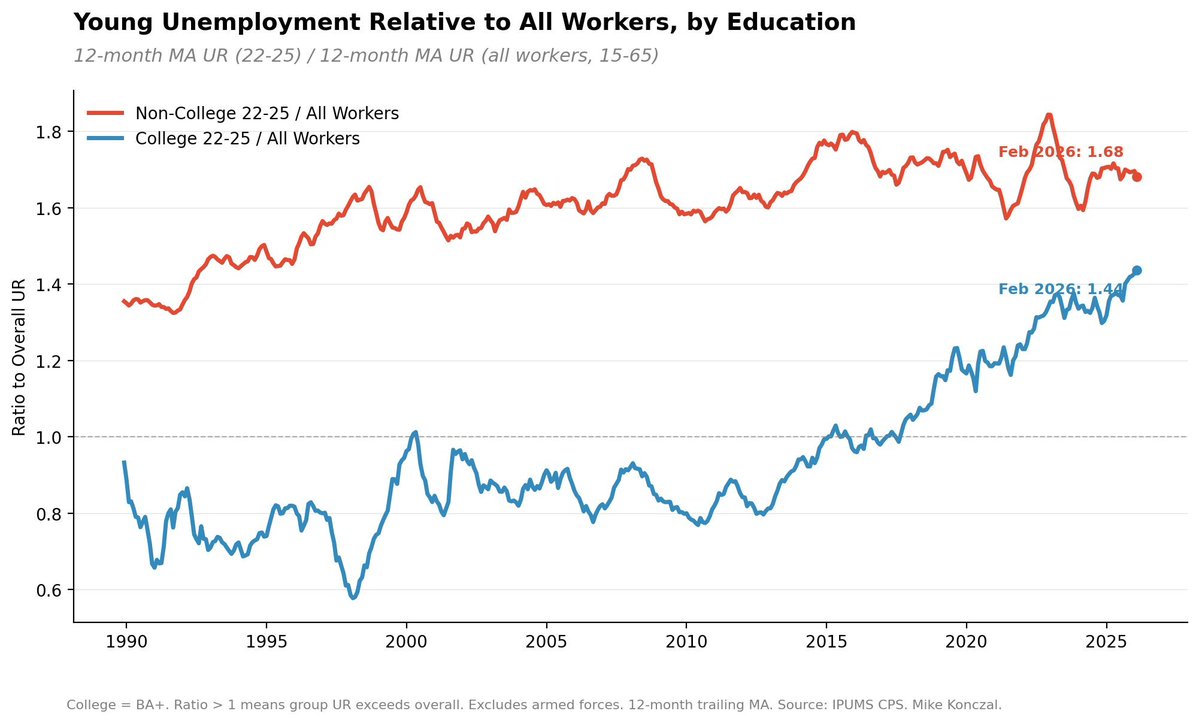
I have a story up today about why young college grads are feeling so angry: It’s more than just rising unemployment and the threat of AI. It’s a deep sense of betrayal. 1/ nytimes.com/2026/03/27/bus…

English
5
14
59
14.5K
Jared Bernstein
Jared Bernstein@econJaredB·
@jasonfurman @mattyglesias Eg, Katz et al years ago argued low relative supply of college workers pushed up educ premium. What happened? Did tight labor markets in latter 90s boost relative low-end growth? Relative “skill” supplies shift?? Clearly need to read the paper Matt linked to.
English
1
0
1
240
Jared Bernstein
Jared Bernstein@econJaredB·
@jasonfurman @mattyglesias I definitely take the levels point (see “very reasonably” above). Just wondering how and if stagnation plays into decisions/behavior. And what’s the source? High end slowing or lower end accelerating? What happened to SBTC?? I think these are important questions.
English
1
0
1
183
Jared Bernstein
Jared Bernstein@econJaredB·
...and you see the problem. All speculative, and the resiliency point cannot be discounted. But putting those observations together is leaving me more spooked.
English
0
0
1
216
Jared Bernstein
Jared Bernstein@econJaredB·
...of shutting down the SoH, taking TACO off the table. Last seen, mid-level hourly wages were growing 3.7%, and given job market weakness, that's unlikely to accelerate. Add in the fact the consumer spending is 70% of GDP and has consistently powered US macro in recent years...
English
1
0
1
278
Jared Bernstein
Jared Bernstein@econJaredB·
My recession probability has been only slightly bumped up due to the war, as unemp still relatively low, biz inv pretty good, productivity up, US econ highly resilient. But new developments make me more nervous about near-term macro. Core concern: real wage growth could stall.
English
1
0
1
379
Jared Bernstein
Jared Bernstein@econJaredB·
That's the 30-yr fixed rate mortgage and it's up from 5.99% the day before the war to 6.53% today. That's $140 more per month on mortgage payments but bigger deal is how it likely freezes nascent refi action that was starting to percolate at <6%.
Jared Bernstein tweet media
English
1
0
2
336
Jared Bernstein
Jared Bernstein@econJaredB·
@MarioIsmailanji @besttrousers Roughly extrapolate pre-pandemic trend in price level and use log dif between that trend and actual inflation. Will circulate draft ASAP.
English
0
0
2
115
Jared Bernstein
Jared Bernstein@econJaredB·
@R2Rsquared Interesting! Agree that shocks raise sensitivity to the next shock (esp. if it follows shortly). Your paper boosts my concern that the war-driven energy price shock soon after the Covid/fiscal shock could de-anchor expectations more so than had it come later.
English
0
0
0
32
Ricardo Reis
Ricardo Reis@R2Rsquared·
How much did public deficits contribute to the inflation surge of 2021-24? A popular argument notes that inflation rose in the US by almost as much as in other OECD countries. Yet, the US had a large fiscal stimulus in 2021 that most other countries did not. Therefore, the US fiscal stimulus did not contribute to the inflation surge. Is that right? No, it is not. To inspect this claim, you can use expectations data. By virtue of its mandate, the IMF is one of the best forecasters of fiscal variables and all economists pay attention to them. The IMF also forecasts inflation; during 2021-24, it was as right or as wrong as other institutions or surveys. Start from the IMF's forecasts in October of 2019 for the next 5 years of how much public debt would grow and what would be fiscal deficits, interest rates, inflation, and growth rates. Then look at the IMF April 2025 reports of those actual variables. Subtract one from the other and you have how much of the unexpected increase in public debt was due to unexpectedly high deficits, unexpectedly high interest rates, unexpectedly low growth rates and unexpectedly high inflation. The plot compares the unexpected high deficits with the unexpected high inflation terms for OECD countries, using the common units of their impact on the public debt. For countries that ran higher unexpected fiscal deficits, inflation was also unexpectedly higher. Some countries had their stimulus early, others only later. Somer larger, other smaller. Some had more, others less inflation. The accounts of the government let you consistently sum these differences over the 5 years to look beyond timings and to use consistent units. Thinking in terms of surprises and using expectations data allows you to compare countries with very different fiscal trajectories. More generally, in all models and theories of inflation, including fiscal account, expectations are crucial. Using expectations data to inspect them is very informative. Note: as with the initial claim, the plot is a correlation, not a causal statement. Sources: (i) Section 4 in Reis "Why Did Inflation Rise and Fall in 2021-24? Channels and Evidence from Expectations" (ii) This simple exercise is inspired on the analysis of Barro and Bianchi “Fiscal Influences on Inflation in OECD Countries, 2020-23.”
Ricardo Reis tweet media
English
37
149
624
202.7K
Jared Bernstein
Jared Bernstein@econJaredB·
@ernietedeschi Great post--highly resonant, rich set of facts. A few ? re HH inc. Where do you get post '24 (interpolating from monthly CPS income bins??); does that match Census through '24?; where is this trend relative to pre-pandemic? Last I looked real was barely back. I'm subscribed!
English
1
0
2
170
Ernie Tedeschi
Ernie Tedeschi@ernietedeschi·
Real household income, which is highly correlated with spending, is broadly up since 2022 across all income terciles, but most so at the bottom, though growth at the bottom did flatten out for a time in late 2024/early 2025.
Ernie Tedeschi tweet media
English
6
12
63
8.9K
Ernie Tedeschi
Ernie Tedeschi@ernietedeschi·
Everyone’s talking about the K-shaped economy—the rich pulling away while everyone else stagnates. In our inaugural Stripe Economics post, I take a look at @stripe + macro data, and I see the K on Wall Street, but not yet on Main Street: • The most profitable third of US public companies now account for ~2/3 of total market cap—the highest on record. • The S&P 500 rose 16.5% in 2025, and the top 1% own ~40% of all equities. So unsurprisingly the top 1% wealth share has risen (~2pp) since 2022. • BUT, Stripe data suggest lower-income household spending has been growing faster than high-income households over the last few years. • Wages tell a similar story: real earnings at the 10th percentile grew ~0.5pp slower than the 90th since 2022, but BOTH posted positive real wage growth. • Why? 1) The wealthy hold lots of equities but only account for ~25% of consumer spending. 2) Real wages at the bottom have been supported by continued labor market tightness post-pandemic, though this may cool. Read the full post below and subscribe! stripeeconomics.substack.com/p/k-shaped-eco…
English
18
71
385
122.9K