BuzzMeData
69 posts

BuzzMeData
@BuzzMeData
Your daily dose of #Data insights, news, trends, and interview questions. Stay ahead in the world of analytics! 📊💡 #DataTrends #Analytics
Canada Tham gia Ekim 2023
71 Đang theo dõi2 Người theo dõi
BuzzMeData đã retweet

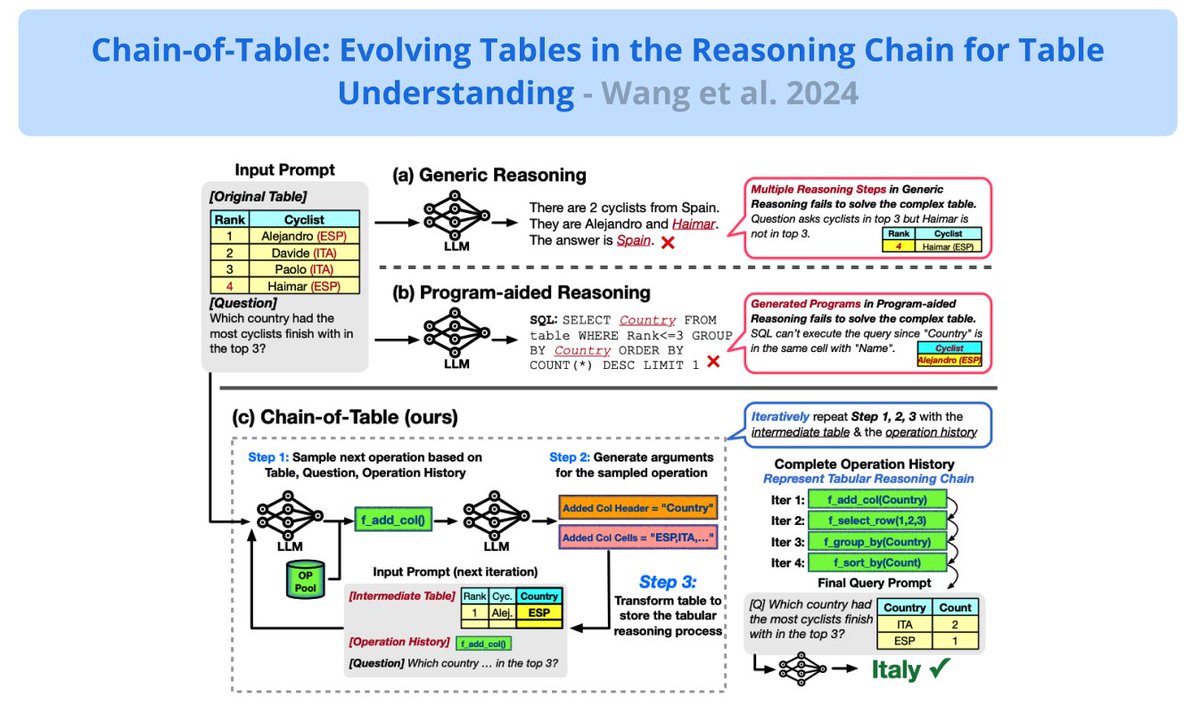
Prompting LLMs for Table Understanding
A new framework to improve understanding of tabular information with LLMs.
Inspired by Chain-of-Thought prompting, it instructs LLMs to dynamically plan a chain of operations that transforms a complex table to reliably answer the input question.
An LLM is used to iteratively generate operations, step-by-step, that will perform necessary transformations to the table (e.g., adding columns or deleting info).
Looks like a nice approach to improve the reasoning, accuracy, and reliability of LLMs when dealing with more structured information like tables. Looks very promising.
I wonder how this would look for graph structures? Or there is probably a paper out that I missed.
English
BuzzMeData đã retweet

Database types explained in simple terms.
We just released an article in our weekly newsletter covering:
— Relational databases
— Vector databases
— Graph databases
— And more…
Missed the issue? Check it out here: drp.li/luc-newsletter…

English
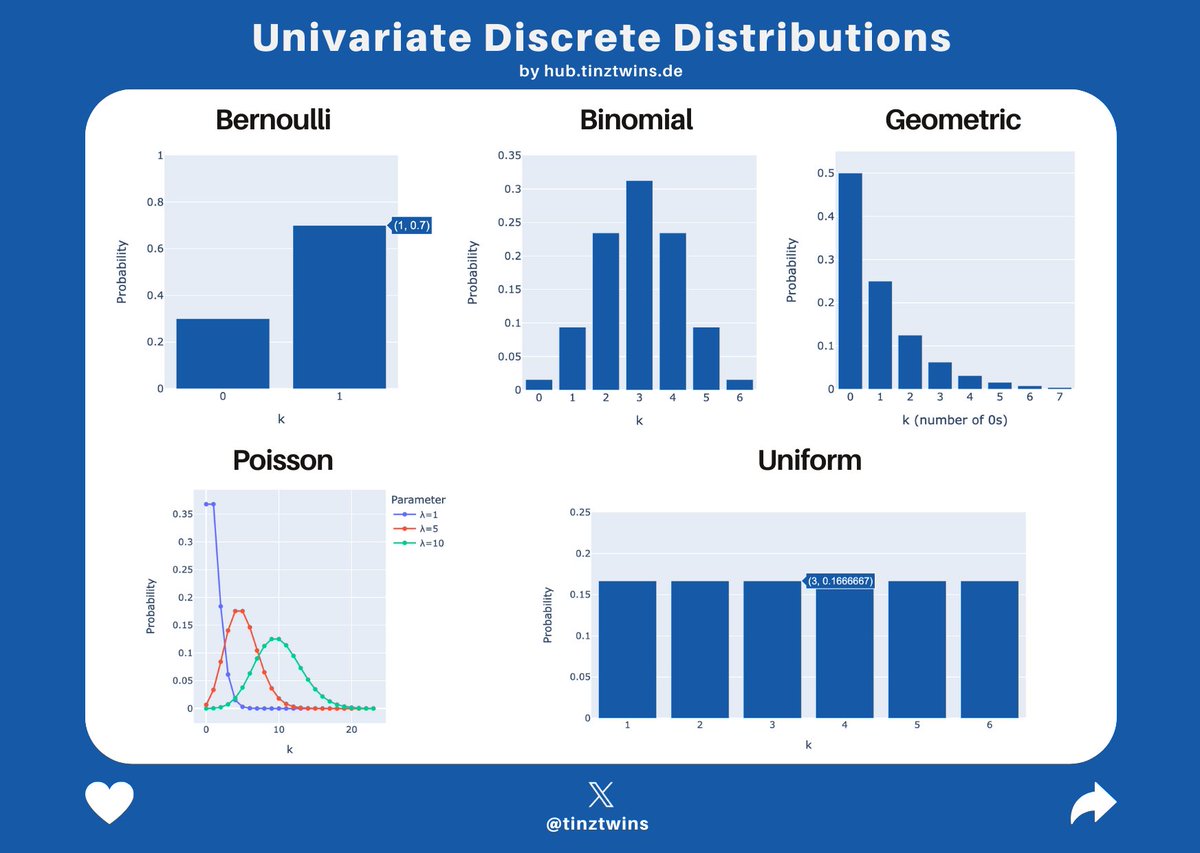
@tinztwins Thanks for sharing! For further discussion about the different types of distributions, I would recommend Harvard stats course m.youtube.com/watch?v=k2BB0p…
English

📊 Univariate Discrete Distributions: An Easy-to-Understand Explanation
You might come across various kinds of univariate discrete distributions in a dataset. Don't worry, we have an easy-to-understand explanation for you.
Let's dive in!
A thread 🧵👇🏽
English
Time Complexity: O((m+n)log(m+n)) - Sorting both arrays. Space Complexity: O(m+n) - Creating a new sorted array.
English
Steps:
1. Combine arrays and sort.
2. If the combined length is odd, return middle element.
3. If even, return average of middle elements.
#DataScience #Algorithms #PythonInterviewQuestions
English
Problem: Median of Two Sorted Arrays
Given two sorted arrays nums1 and nums2 of size m and n respectively, return the median of the two sorted arrays. And what is the expected space and time complexities? #DataScience #InterviewQuestion
English
BuzzMeData đã retweet

🔥 By far the best guide to understanding attention mechanisms in transformers!
In an era of oversimplified content, the real art of explanation – reducing complexity without the jargon.
youtube.com/watch?v=g2BRIu…
🚀 #Transformers #AttentionMechanism #SimplifyComplexity"

YouTube

English
BuzzMeData đã retweet


Cohort Analysis 📊: Segment users based on behavior. Identify segments with the steepest engagement decline.
#DataScience #EngagementDecline #DataAnalytics #UserEngagement
English
Product manager asked you (as a #DataScientist), why the engagement dropped 9% this month compared to past month? #InterviewQuestions #DataScienceInterviewQuestions ?
Do you want some candidate answers? Please check the thread below:
English
English
BuzzMeData đã retweet

Hypothesis testing is an inferential statistical method.
It’s often employed to make informed decisions based on available evidence.
At its core, hypothesis testing involves assessing the validity of a proposed hypothesis by evaluating sample data.
The process typically begins with formulating two distinct hypotheses:
The null hypothesis (H0) and the alternative hypothesis (H1).
The null hypothesis represents the absence of any significant effect or difference.
While the alternative hypothesis suggests the presence of a notable effect or difference.
Subsequently, a relevant statistical test is selected based on the nature of the data and the research question at hand.
Some of the prominent tests include:
The t-test, ANOVA (Analysis of Variance), Chi-squared test, Regression analysis, etc.
This chosen test generates a test statistic, which quantifies the extent to which the observed data aligns with the expectations set by the null hypothesis.
By comparing the test statistic to a critical value or calculating a p-value, data scientists can make informed decisions about the hypotheses.
A p-value is a crucial metric in hypothesis testing, representing the probability of observing data as extreme as, or more extreme than, the data actually obtained under the assumption that the null hypothesis is true.
A small p-value indicates strong evidence against the null hypothesis, prompting researchers to consider the alternative hypothesis as a more viable explanation for the observed data.
It is important to establish a significance level (often denoted as alpha) before conducting hypothesis testing.
This significance level sets the threshold for determining whether the obtained p-value is sufficiently low to reject the null hypothesis.
A lower significance level corresponds to a more stringent criterion for rejecting the null hypothesis.
Its blend of structured statistical methods and critical thinking fosters accurate decision-making, making it an indispensable tool within the toolkit of a discerning data scientist.
---
That’s all for now!
- Smash the LIKE button and REPOST
- BOOKMARK because you’ll definitely want to revisit this again
- Follow me for more posts like this

English
14 Exciting Python Project Ideas & Topics for Beginners
analyticsvidhya.com/blog/2023/10/s…
#Python #MachineLearning #DataScience
English
BuzzMeData đã retweet
Logistic Regression is for Yes or No, 1 or 0, Black or White.
Imagine you're trying to predict if it will rain or not.
You have data about the past, like the temperature, humidity, and whether it rained or not.
You want to use this data to predict if it will rain tomorrow.
Logistic Regression is a statistical tool that helps you with this prediction.
It's used for binary outcomes, like yes or no, 0 or 1, or in our case, raining or not raining.
Here's how it works:
Sigmoid Function:
Logistic Regression uses a special function called the sigmoid function. Think of it as a way to squash any number between 0 and 1.
It's like making a probability. If the sigmoid function gives you 0.7, it means there's a 70% chance it will rain.
Data and Weights:
You have your data (temperature, humidity) and some initial guesses called weights.
These weights are like how important each factor is for the prediction. You start with random weights.
Combine and Squeeze:
Logistic Regression takes your data, multiplies it by the weights, and adds everything up.
Then, it pushes this through the sigmoid function. This gives you a probability, like our 0.7 for rain.
Training:
At first, your predictions will be far from reality. But you have the actual results (did it rain or not) from your past data.
You compare your prediction with reality and see how wrong you are. Then, you adjust your weights to be less wrong next time.
You do this again and again until your predictions are quite accurate.
In a nutshell, Logistic Regression helps you make predictions when you have data that falls into one of two categories.
It turns your data into a probability, and with a bit of training, it can make pretty good predictions.
---
That’s all for now!
- Smash the LIKE button and REPOST
- BOOKMARK because you’ll definitely want to revisit this again
- Follow me for more posts like this


English
BuzzMeData đã retweet

Easy-to-use, open source Gaussian Splat viewing
coming soon in spaces, which will make it easy to view, share, and generate scenes
huggingface.co/spaces/dylaneb…
English