Tweet ghim
Anass
891 posts


@DanielMusanni Pazzesco quello che dici, è da approfondire…avresti qualche dritta su dove guardare ?
Per quanto riguarda la put la sto ‘cavalcando’ da ottobre, mi piacerebbe avere un altra fiammata di vola, il mio target con questa put sono i 48k


Italiano

@macsleverage Spero di cuore che ti vada bene
Non ho le prove ma secondo me dietro ai dump di BTC c'è la BOJ e Nvidia. La prima perché l'hanno inventato e lo manipolano, la seconda perché l'hanno minato forti della loro posizione e fanno cassa per tenere il Titolo a 195/200$
E stanno x dumpare
Italiano
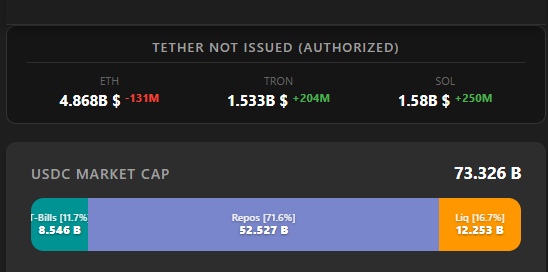
8Bln Tbills in Circle
12bln Liquid
1.6bln USDT on Sol
1.5bln USDT on Trx
4.9bln USDT on ETH
Only one is for pump
Only one is for dump
Only one is for rekt...
Play your game
English
@DanielMusanni Grazie per questa risposta apprezzo molto 🙏🏽🙏🏽
Le mie put a lunga scadenza su BTC attendono pazientemente l’esplosione di volatilità, secondo me un “volmaggedon crypto” sarebbe perfettamente in linea con questi dati su: liquidità + Saylor + BOJ + Fed & Macro
Italiano
@macsleverage Solo chi ha memoria del passato può conoscere il futuro
Esatto oltre i 4bln in ETH non si sono mai visti...
E l'ultima volta che erano così alti... è andata male
E si risposta esatta, SOL è usato da Circle/Coinbase per il dump & rekt con ETH
Italiano
@martypartymusic @MacroBombastic But the stables issuers dollars didn’t they go to the banks ?
English

@MacroBombastic Stable coin is the onramp not bank dollars.
English
There is zero need for centralized exchanges.
End them all.
If orderbooks are not decentralized prices are not honest.
English
Anass đã retweet

Sudden distrust after a long period of trust is irreversible.
English


@DanielMusanni Dubito tornerà indietro di nuovo da qui, o comunque i 90K li vedo molto più distanti di quel sembra
Italiano
If from here the Stablecoin Dominance goes down will be an infinite pump
Otherwise a real Bloodbath incoming...
But my algo say PCC SHORT... 🔨

English
Anass đã retweet

THE BIGGEST MISTAKES OF RETAIL TRADERS
▫️Bayesian thinking
Amateurs believe a trader should act like a politician: taking a stance and sticking to it through thick and thin. If they change their mind, it is viewed as "embarrassing" in the eyes of the crowd. Professionals, however, are always Bayesian thinkers. If the facts, the charts, or the economic data change, you must also change your position immediately, rationally, and without emotion. You either learn and accept this, or you are going to crash and burn very badly.
Financial markets—much like the weather—are non-linear, chaotic systems where the "butterfly effect" prevails. The market is a dynamic, constantly evolving open system where new information and external forces flow in minute by minute. Some argue that the market is fractal. But this is not entirely true; it only appears to be fractal. On minute and second charts, the vast majority of price action is driven not by fundamental changes in value, but by liquidity hunting, the skirmishes of high-frequency trading algorithms, and order book dynamics. Therefore, the signal-to-noise ratio is at its absolute worst on very low timeframes. This is why so-called "Cognitive Flexibility" (based on Professor Tetlock's work) is indispensable.
Trading is not chess, where we can see all the pieces on the board; it is poker. As the cards are dealt (as new data arrives), probabilities must be constantly recalculated. We weigh the odds: "What cards do the others hold? Should I fold my hand before the weekend, or stay in the game?" The analogy of blackjack and card counting also applies: we only place large bets when the deck favors us (this is called a "hot deck"); otherwise, we minimize our risk. This game is simply not for those who cannot tolerate uncertainty.
This is exactly why a high win rate (strike rate) is not important at all. A trader can have a win rate of merely 15% and still make a fortune. How? By keeping their losses as tiny, insignificant "tests" (just "dipping their toes in the water" to gather information), but when they catch a massive trend within that 15%, they make a killing. A counterexample is Al Brooks, who scalps tiny price movements with 20 trades a day. He has an exceptionally high win rate, but his return per trade is very small.
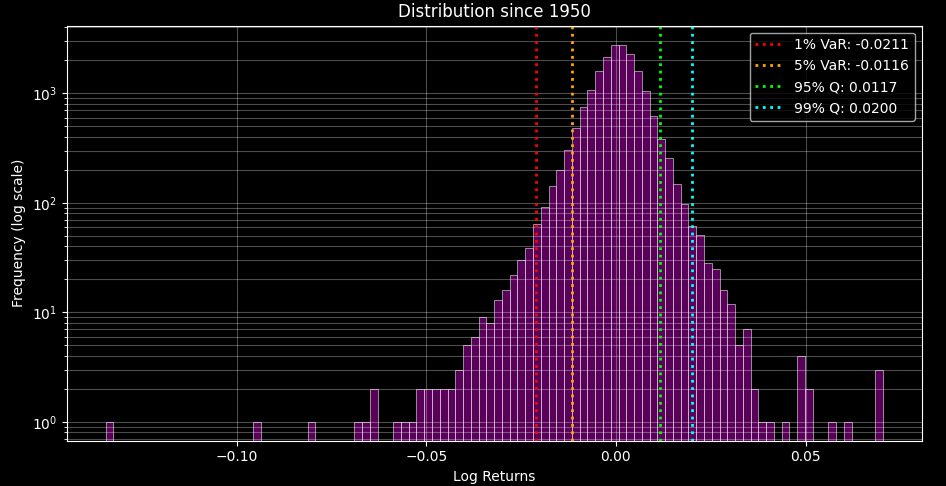
This is the hardest concept for retail traders to grasp, because intuitively, the untrained mind fundamentally assumes a symmetrical Gaussian distribution. Market returns, however, follow power-law and fat-tailed distributions (see the research of Mandelbrot and Taleb). This means that the overwhelming majority of market returns are generated by a few rare, extreme-magnitude moves. The most successful trend-following funds (CTAs), for instance, deliberately operate with low (30-40%) win rates, but they strictly cut their losses and let their portfolio-saving, massive winners run. This is called positive asymmetry. This is what I constantly emphasize to my followers as well, providing calculation methods for it. (Incidentally, this is also a central issue in machine learning, known as the Multi-Armed Bandit problem).
The large institutional players trade by mapping out market possibilities and probabilities (how many paths lead to each outcome, thereby allowing those options to be weighted), as well as identifying the precursors to each outcome (which levels will confirm or invalidate the fulfillment of a scenario). They then execute micro-trades if they see momentum shifting toward one outcome or another. If they lose, they lose a little. But if the bet pays off, they scale up the position. Size up the winner, cut the loser. To this approach, I can also attach expected dynamics using speed profile and vanna profile analysis, since options positioning data is essentially a simultaneous bet on both the spot price and volatility.
Therefore, you must let go of the ego-driven need to "always be right." In a random system, you cannot truly be right, because it does not operate by the strict rules of logic. On the very rare occasions it does, it usually stems from the interpretation of external information. Thus, you are neither right nor wrong in the market; you simply either catch the move or you don't. The other crucial point is that you must trade the distribution, not your fantasy.
The market is not a deterministic system, despite how much many people seek and desire it to be. Do not look for certainty in a stochastic system. The only thing that will keep you afloat is a well-planned, rational, and consistent systematic approach backed by self-discipline. An analyst's job, competence, and quality typically boil down to how accurately they map out these possibilities, dynamics, and probabilities. But since we operate in a randomized, non-symmetrical system with an ever-changing distribution, an analyst's performance will inherently fluctuate as well.
Based on my own backtests, my expected dynamics and level-bound dynamics were accurate 58-62% of the time, while my geopolitical forecasts hit a 73% accuracy rate...
SOME PRACTICAL TIPS
▫️Using the Volume Profile is crucial.
Price is always king. Volume is a secondary, supplementary tool that, by itself, never provides a buy or sell signal. Its sole purpose is to confirm (or question) the price action by placing it into context.
I always emphasize the importance of the first 20-30 minutes. If the volume in the first half-hour is exceptionally high, it signals a trend day. In this scenario, the market gets a green light: institutions are present, breakouts can be traded confidently, and there is a high probability that the price will close near the extremes of the daily range (in the bottom/top 10-15%). Conversely, if volume is low, the market will only chop sideways and be driven by daily options flows (gamma profile). During these times, most breakouts will be fakeouts, and the focus should shift to trading inward from the edges of the range—i.e., mean reversion trading. This is further confirmed by checking the type of iron fly profile the market adopts, short or long. One is a bet on momentum, while the other is a bet on ranging.
When the price breaks through a clear support or resistance level (confirmed by at least two prior touches), volume must spike dramatically. The real trick is that the first minor pullback following the breakout must occur on very low volume, and the price must not retrace below 62% of the breakout candle. This is the perfect trend-continuation entry. Once a trend is successfully caught, I usually trail my stop-loss order just below the low of the last high-volume candle (in the case of a long position). The logic is that this is where the large institutions stepped in; if they allow the price to drop below this level, the "big boys" are no longer defending the market, meaning I have no business being there either.
If a massive volume spike suddenly appears at the very end of a long, extended trend, far away from support levels, it is a sign of exhaustion. It represents the FOMO panic of latecomer amateurs and a few artificially induced capitulations. This is not an entry signal; it is the absolute best exit point. If you were in the trade up to this point, this is where you lock in profits, because it is almost always followed by a violent snapback (reversal).
Similarly, if volume diverges while the price is testing resistance, it indicates exhaustion, which can also be confirmed with RSI and MACD, as they trigger algorithmic reactions. If the market tests a level (even after a drop) and suddenly reverses with extreme volume in the opposite direction, it signals that the dynamics of the previous trend have been invalidated.
Daily VWMA, VWAP, and AVWAP levels are incredibly important, as are the Initial Balance and Value Area levels on a TPO chart.
Here, according to Steidlmayer, when price opens outside the previous day's Value Area and then re-enters and is accepted (spending 2+ TPO periods inside the VA) back inside, there is an 80% statistical probability that price will travel to the opposite side of the Value Area.
In my own analysis, I always examine what dynamics and realized volatility expectations traders are assigning to specific zones via the options market. Deviations from these expectations, or the actualization of the anticipated dynamics, provide a massive informational edge and help map out the distribution much more accurately, thus reducing the number of micro-trades required. Anyone who followed my live intraday momentum signals last year and the year before knows exactly what I am talking about.
An additional pro tip: it is highly recommended to apply a very slow 150-200 period Bollinger Band directly to the volume bars, plotting the 3, 3.5, 4, 4.5, and 5 SD levels. Personally, I also like to adjust the SD levels using the Cornish-Fisher expansion based on the skewness of the volume's own distribution, a technique I demonstrated in my educational post on mean reversion trading. (This is because Standard Deviation is inherently based on a Gaussian distribution). This helps immensely in judging whether a volume move is genuinely statistically significant or not.
One more advanced trick: I monitor the standard deviation of the deviations from the volume's moving average. This is even more precise, because here I am comparing the magnitude of the deviations from the mean. A specific volume spike might look high to the naked eye, or even in terms of simple standard deviation, but it might not actually be statistically unusual.
I consider services like order book depth, footprint charts, market delta, etc., to be completely useless, as the overwhelming majority of market volume is executed by algorithms. Large funds operate using "Iceberg" orders and VWAP time-slicing. They intentionally mask their true intentions in the order book, meaning you will always just be chasing micro-noise. Furthermore, it provides absolutely no actionable forward-looking edge. The only thing that is truly predictive is options positioning, but even there, I don't care about the daily intraday noise; I am solely interested in the pre-open data. That data reveals true market sentiment—i.e., what traders actually think about the underlying market structure. @OptionsDepth
The rest is just smoke and mirrors and pseudo-intellectual overcomplication.
Alma.Trk@alma271828
Stop trying to predict tops you'll burn yourself... When the market was below 6400, I called the bottom. I marked a certain pivot that tells us whether there will be another downside retest or not. I personally expected one, but I also said that if that level is solidly broken, the $SPX will go above 7k. Then two weeks ago, when the market was at 7086, I indicated that 7200-7300 would come before any kind of pullback. Not a trend change, but a pullback. I did this in a free post. Yes, there are many gaps below the price level; it is unstable, right-tailish, and very overvalued. But since April, this market hasn't been about valuation—nor even since 2016 for that matter. Rather, it is headline-driven. That is why they are lying that the war is over, to moderate sentiment and squeeze out downside long vol trades, reducing short-term tail risk, because a pullback might come next week that builds structure. But the inflow remains high. The distribution is bimodal, with a huge right-tail. This is key☝️ However, the economy is in an inflationary spiral. The Iranian war is not over, cyber warfare and local ops are still ongoing; they just dialed back the news coverage so it doesn't disturb risk sentiment. But even if it were over, it wouldn't solve the stagflationary shock it triggered, the effects of which haven't even hit the economy yet. Ships are bypassing Africa, shipping times are very long, insurance premiums are sky-high, there is a lack of proper real-time information, etc.—the market is not pricing these in. By autumn, in Q4 (as I have been writing for months), this will drive up energy prices, the biggest victim of which will be the overvalued AI/tech sector. In addition, core inflation is stuck around 4%, ISM prices are sky-high, and the passing of tariffs/costs onto consumers has drastically accelerated. Since inflation is rising but the central bank is not raising interest rates, real interest rates have collapsed—which practically means 'passive monetary easing.' The bond market is too complacent and is not pricing in the danger. If the Fed doesn't act now, it will later be forced into panicked, harsh (even 200 basis point) tightening. Under Warsh, the Fed might fall behind the curve if it underestimates the second-round effects of strong demand and the energy market shock. 🚩Market liquidity is currently provided by machine algorithms (HFT, Pod shops); true price discovery is missing. When the structural sell-off starts, or the AI narrative disappoints, liquidity will evaporate instantly. ☝️But as I usually write: not now. This is not an immediate thing; rather, it is gradually building into the economy. For now, it is not yet priced in. They are inflating the bubble as long as they can. Citadel doesn't want to sell right now either. As long as possible, they will squeeze everything they can out of this. But there will be a point when AI capex becomes obviously unsustainable, and reality catches up with fantasy. That is why this is a trader's market, not an investor's market. I don't understand this retail top-chasing mentality... one wants to short at all costs, the other is complacently BTD-ing. For a good while now, I have literally been propagating the latter, but only smartly. The market won't go up forever. Trade the structure, not your illusions. And don't try to predict, because in a rigged system, you can't.
English


@Liathetrader I think it’s a bit early to say that “it held again”, it can take just a couple of hours to wipe out days of up trend
English

That Bitcoin bounce to $78K wasn't luck.
I've been watching this ascending trendline for months - connects 2018, 2020, and 2022 cycle lows.
It held. Again.
Now we face the real test: breaking through years of bagholders above us.
The levels that matter most 👇
tmad.net/p/tmad-crypto-…
English

Magari fa una candelina verde prima della mezz’ora
Italiano
Anass đã retweet

Just in 🚨
Strait of Hormuz will now be open only during regular US trading hours. Monday to Friday 9 to 5.
Closed on weekends.
English


Happy Bridge and Power Plant eve!
Iran should take President Trump at his word and make a deal, or they will soon face the full fire of America’s military.
America is not playing games.
English
@ChartMind Presa di posizione audace visto che non è cambiata affatto (se non peggiorata) la situazione per le crypto da inizio anno.
Penso che non rivedremo btc stabile sopra 80k per un bel po’ ed il prossimo target è 50k Q2 o Q3 2026
Italiano

1st week update: +35%
Still inside the range with area 72k-73k as major resistance (don't think #BTC will break it with confirmation) with some potential target price of 65k-60k if vol regime stays the same as last week, otherwise an intra-week shock could send #BTC to 53k-50k

Anass@macsleverage
English