
Dantek - TTF Bot
1K posts

Dantek - TTF Bot
@TTFBot
Crypto investor, trader, and stacking Sats since 2021 | Founder of TTF Bot helping degens trade safer and smarter | Paid many tuition fees throughout my journey
TTF Bot for DYOR Scanning 加入时间 Ocak 2023
3.3K 关注6.2K 粉丝


Everyone is calling for the bottom because they are tired of bleeding. Thats exactly why its not in yet.
We havent seen the I am quitting crypto phase of the cycle. We have not seen the total silence on the TL. Max pain is lower than your lowest limit order.
Stay liquid. $BTC

English
As far as CAGR goes I'm looking at it per cycle from ATH to ATH.
In prior cycle BTC gave us 36.6% whereas this cycle (if top is in) gave us only 16.3% which is disappointing as I had expected at least 20% for such a volatile and 'being early' asset. If 190k would be the next cycle top, then the next 4 year CAGR would put it at 10.8% :(
I hope the halving cycle doesn't keep rhyming from here and we get a nice surprise this year (smoking hopium)
English
@MisterSpread Excellent analysis which echo's what I plotted on a BTC chart.
x.com/TTFBot/status/…
Dantek - TTF Bot@TTFBot
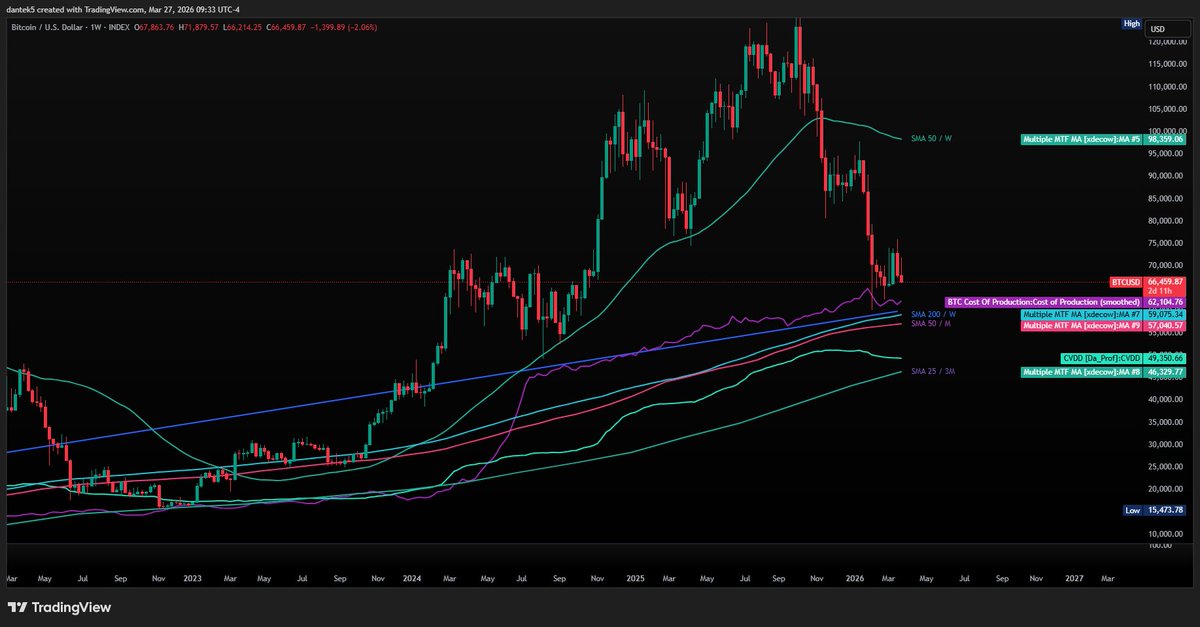
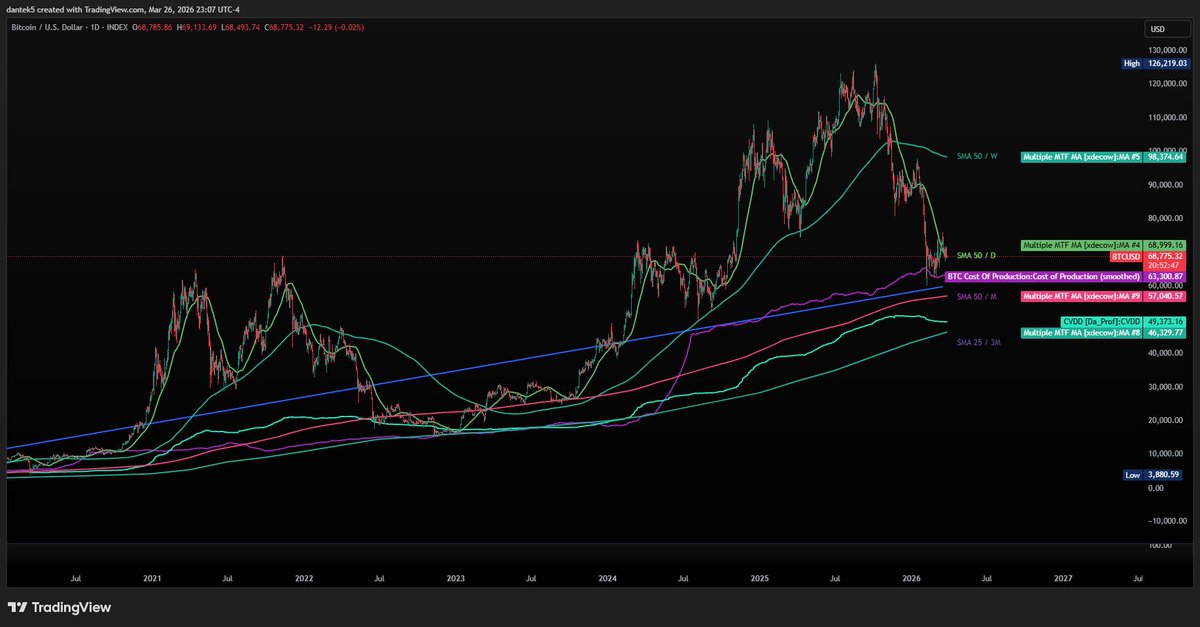
Many Cycle debates past few months. History sure rhymes as far as BTC price action is concerned. Biq question, will it continue to rhyme for the rest of the year or is the bottom in? - Daily, Weekly, and Monthly RSI's at cycle lows - Most Alts at rock bottom prices - BTC has pulled back over 50% from ATH Although: - Cycle tops have rhymed - Cycle bottoms have rhymed - Cycle tops to bottoms have rhymed - Pullbacks have rhymed - Fib retracements have rhymed Will the next bottom rhyme as well with timeline and pullback level?
English

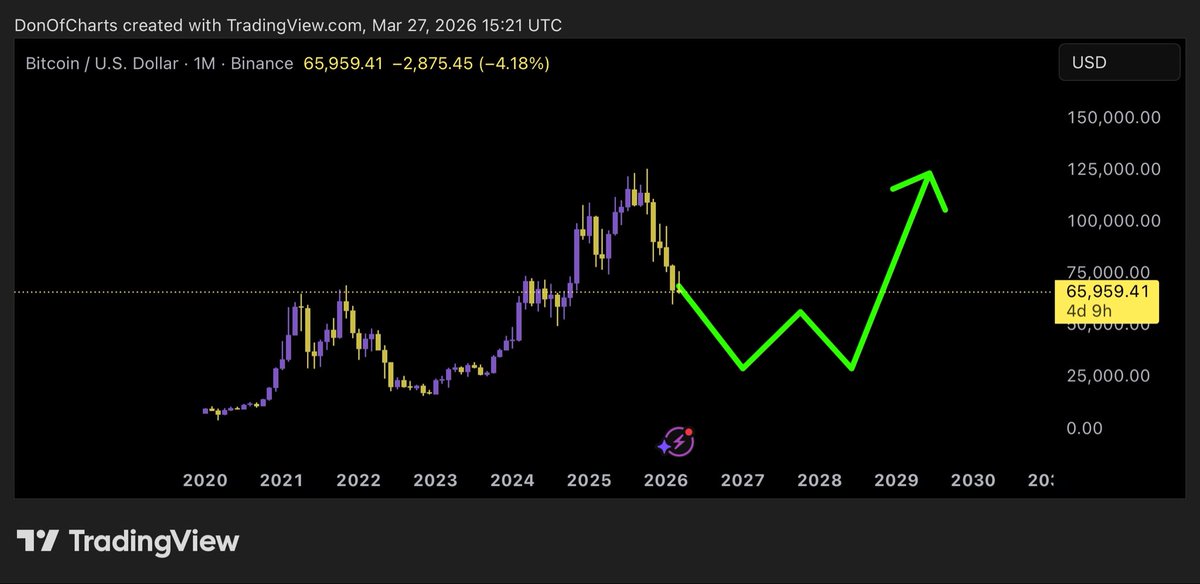
Is #Bitcoin math?
What if BTC is following a predictable timeline of tops, bottoms, and blow-off peaks?
Here’s a model projecting the next potential ATH and why $190,000 by 2029 is aligned with previous cycles.
Bookmark this. Let’s dive in: 🧵👇
Last cycle:
Bitcoin topped ~Oct21 > Nov22 (~378days)
Last bottom to top:
~Nov22 to Oct25 > (~1064days)
This cycle:
Bitcoin topped ~Oct25 > Oct/Nov26 (378days?)
Next bottom to top:
~Oct26 to Sept/Oct29 > (~1064days?)
If we do live in a simulation, by this model, the bottom of this bearmarket will be somewhere in Oct/Nov this year.
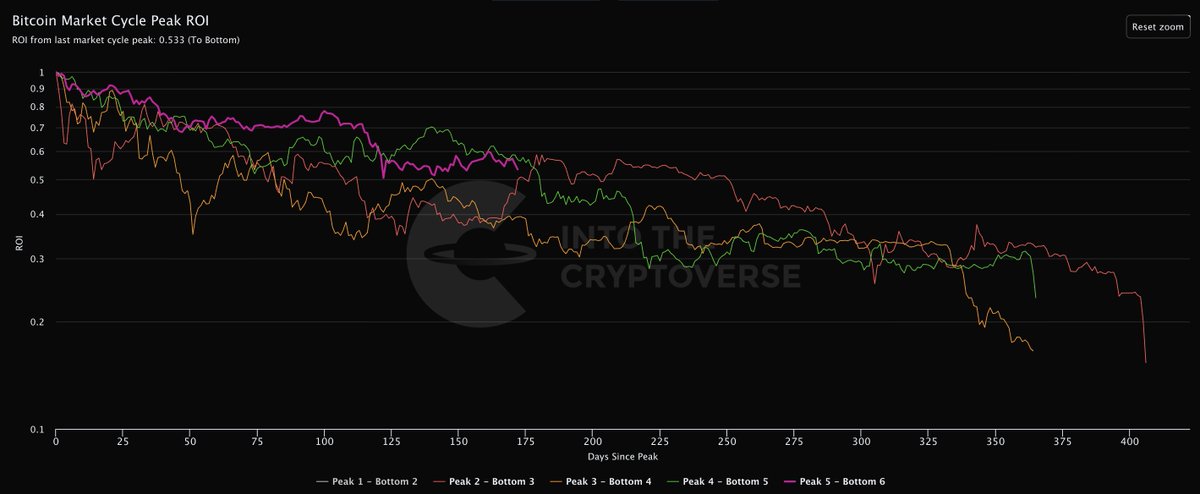
Drawdowns last 3 cycles:
2013-2015: -86.9%
2017-2018: -84.2%
2021-2022: 77.5
If we apply a similar softening trend (say, another ~6% drop), the 2025–2026 drawdown would likely land around:
77.5% - 6% = 71.5% & that would put $BTC around $36k-40k ATL in 2026.
We will be exiting the accumulation zone somewhere in Oct27, +350 days after the bottom, like we did from Nov22 to Oct23.
Based on this model, the next top for Bitcoin will be somewhere between $180,000 - $190,000 in Sept/Oct2029.
The conclusion and investment thesis part, for investors who understand that Bitcoin is a longterm allocation:
Potential CAGR for the next 3 years:
ATL 2026 = ~$40,000
ATH 2029 = ~$190,000
Then the potential CAGR will be ~67.8% year from 2026 till 2029, beating by far #SP500 and most of the other TradFi assets.
As all models, they work until they don't, so take this with a grain of salt, more like a potential guideline based of what happened till now.
NotaBene: the indicator you see on the chart is Ichimoku, the only indicator I've been using for the past 10 years constantly and the red+green Clouds are just potential projections of its structures.
If this helped frame your long-term thesis, hit that like & ReTweet 🫡

English
@MisterSpread @intocryptoverse I don't disagree or agree as we don't know what the future holds based off historical points of interest.
Interesting post on your analysis showing a 190k possible top in 2029 because I have the same theory. Will need to see how you got to that number
English
@TTFBot @intocryptoverse I get it Dantek, problem is we all see it ;) even myself.
That's why we slice through or never tap it
x.com/MisterSpread/s…
MisterSpread@MisterSpread
Is #Bitcoin math? What if BTC is following a predictable timeline of tops, bottoms, and blow-off peaks? Here’s a model projecting the next potential ATH and why $190,000 by 2029 is aligned with previous cycles. Bookmark this. Let’s dive in: 🧵👇 Last cycle: Bitcoin topped ~Oct21 > Nov22 (~378days) Last bottom to top: ~Nov22 to Oct25 > (~1064days) This cycle: Bitcoin topped ~Oct25 > Oct/Nov26 (378days?) Next bottom to top: ~Oct26 to Sept/Oct29 > (~1064days?) If we do live in a simulation, by this model, the bottom of this bearmarket will be somewhere in Oct/Nov this year. Drawdowns last 3 cycles: 2013-2015: -86.9% 2017-2018: -84.2% 2021-2022: 77.5 If we apply a similar softening trend (say, another ~6% drop), the 2025–2026 drawdown would likely land around: 77.5% - 6% = 71.5% & that would put $BTC around $36k-40k ATL in 2026. We will be exiting the accumulation zone somewhere in Oct27, +350 days after the bottom, like we did from Nov22 to Oct23. Based on this model, the next top for Bitcoin will be somewhere between $180,000 - $190,000 in Sept/Oct2029. The conclusion and investment thesis part, for investors who understand that Bitcoin is a longterm allocation: Potential CAGR for the next 3 years: ATL 2026 = ~$40,000 ATH 2029 = ~$190,000 Then the potential CAGR will be ~67.8% year from 2026 till 2029, beating by far #SP500 and most of the other TradFi assets. As all models, they work until they don't, so take this with a grain of salt, more like a potential guideline based of what happened till now. NotaBene: the indicator you see on the chart is Ichimoku, the only indicator I've been using for the past 10 years constantly and the red+green Clouds are just potential projections of its structures. If this helped frame your long-term thesis, hit that like & ReTweet 🫡
English

Bitcoin Dropping - What's Next? x.com/i/spaces/1RKjp…
English
@intocryptoverse Timewise and even pullback level does look like BTC/GOLD has bottomed
x.com/TTFBot/status/…
Dantek - TTF Bot@TTFBot
Is this the rotation we've all been waiting for? Although it started 30 days late from 3 prior cycles
English
@intocryptoverse Yup, aligns with the pullback levels and timelines plotted over BTC chart
x.com/TTFBot/status/…
Dantek - TTF Bot@TTFBot
Many Cycle debates past few months. History sure rhymes as far as BTC price action is concerned. Biq question, will it continue to rhyme for the rest of the year or is the bottom in? - Daily, Weekly, and Monthly RSI's at cycle lows - Most Alts at rock bottom prices - BTC has pulled back over 50% from ATH Although: - Cycle tops have rhymed - Cycle bottoms have rhymed - Cycle tops to bottoms have rhymed - Pullbacks have rhymed - Fib retracements have rhymed Will the next bottom rhyme as well with timeline and pullback level?
English


I just got off a phone call.
It happened.
This is huge for Bitcoin.
Something that will be first of its kind.
More details coming tomorrow!
English

Bitcoin maximalist.
Don’t hand your sovereignty to institutions.
Not your keys, not your Bitcoin.
Don’t let BlackRock own what was built to replace them.
English
This feels like a bear market. If you aren’t building during the bear 🐻 you are making a terrible mistake. Stop wasting time. Do the hard stuff. If you have a project double down. Support the community. Hold the floor. Innovate. When the bull returns you will fly!

English
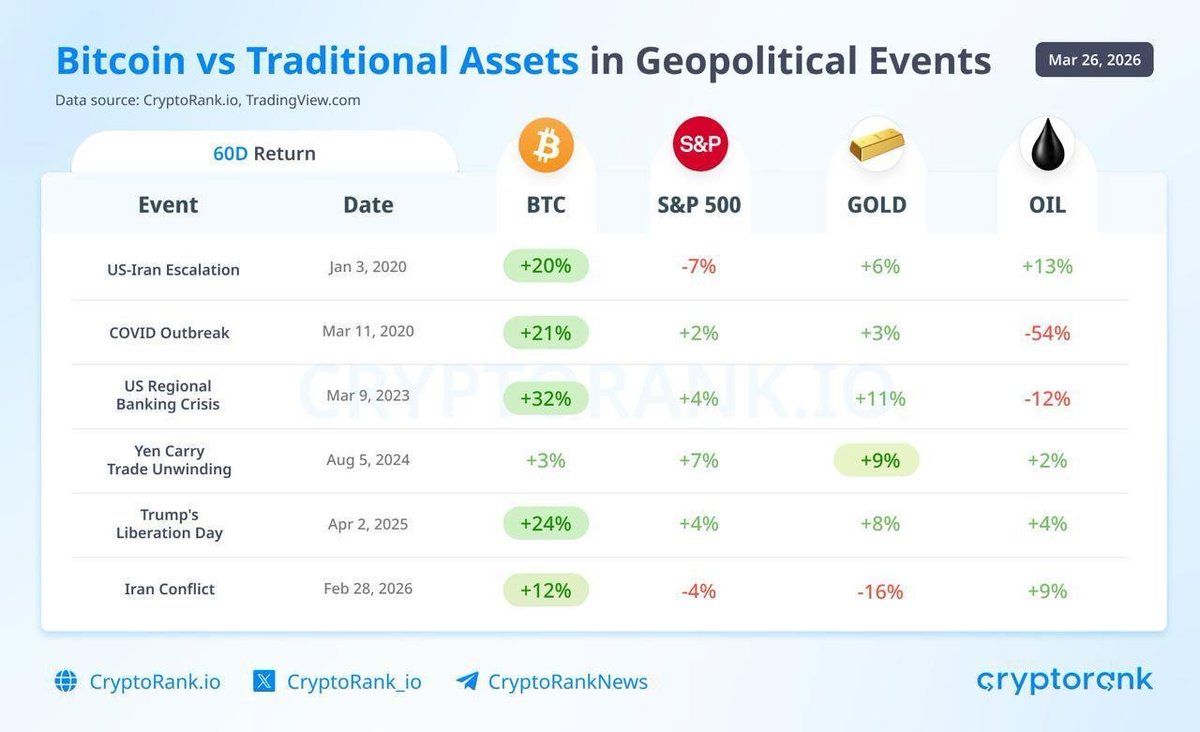
Looks like Bitcoin may be headed for another leg up in April
Rand Group@cryptorand
Bitcoin has consistantly outperformed Traditional Assets in Geopolitical events. We are not at the end of the Iran conflict yet, but history looks like repeating...
English

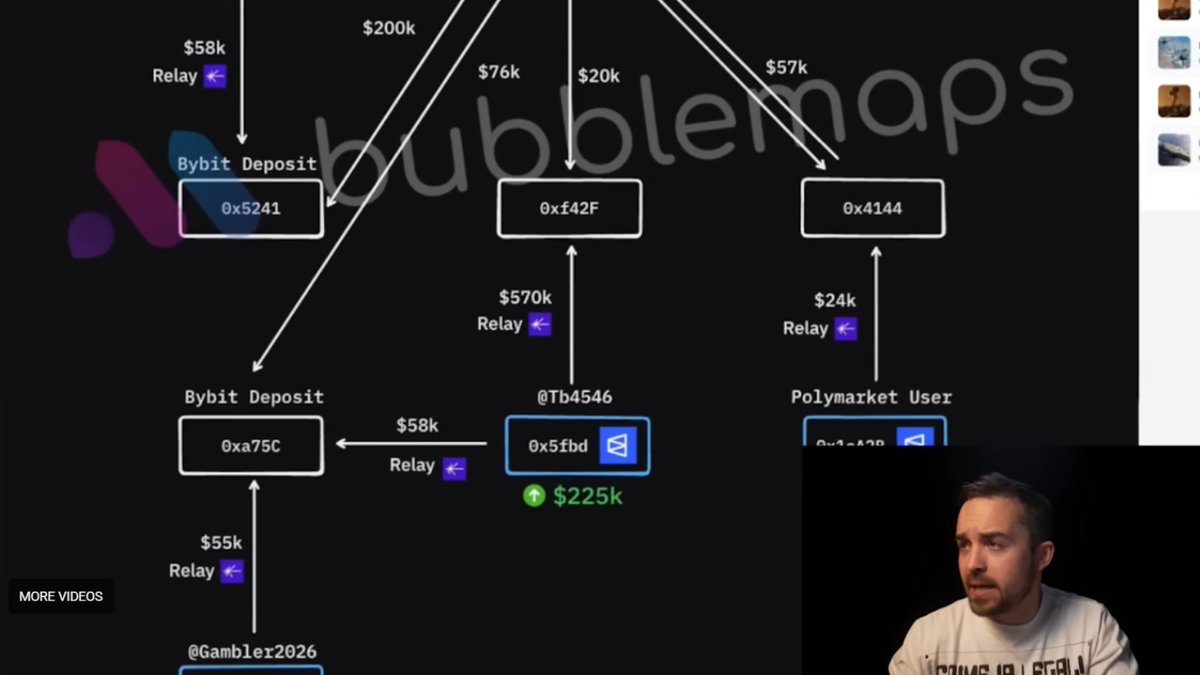
Call it bragging, but I'm extremely proud of this
Our latest investigation made national headlines
> 5+ Live TV segments (One with our CEO)
> Front page of CNN
> Video with Coffeezilla
Yesterday was surreal
This is not why we do investigations, but it is very nice to see our hard work recognized


English
@ZachHumphries Great take about the Bitcoin halving cycle and the business cycle
x.com/intocryptovers…
Benjamin Cowen@intocryptoverse
The reason this four year cycle top for Bitcoin "feels different" is because this is the first major top BTC has had during a late business cycle environment.
It explains why there was no alt season, why BTC has been bleeding to SPX, and why SPX has been bleeding to Gold.
We got a glimpse of this type of environment in 2019 but then the pandemic causes a crisis which reset the business cycle. It also happened during the middle of a four year cycle for BTC, rather than at the end of one.
This cycle has been more brutal because there has not
English


