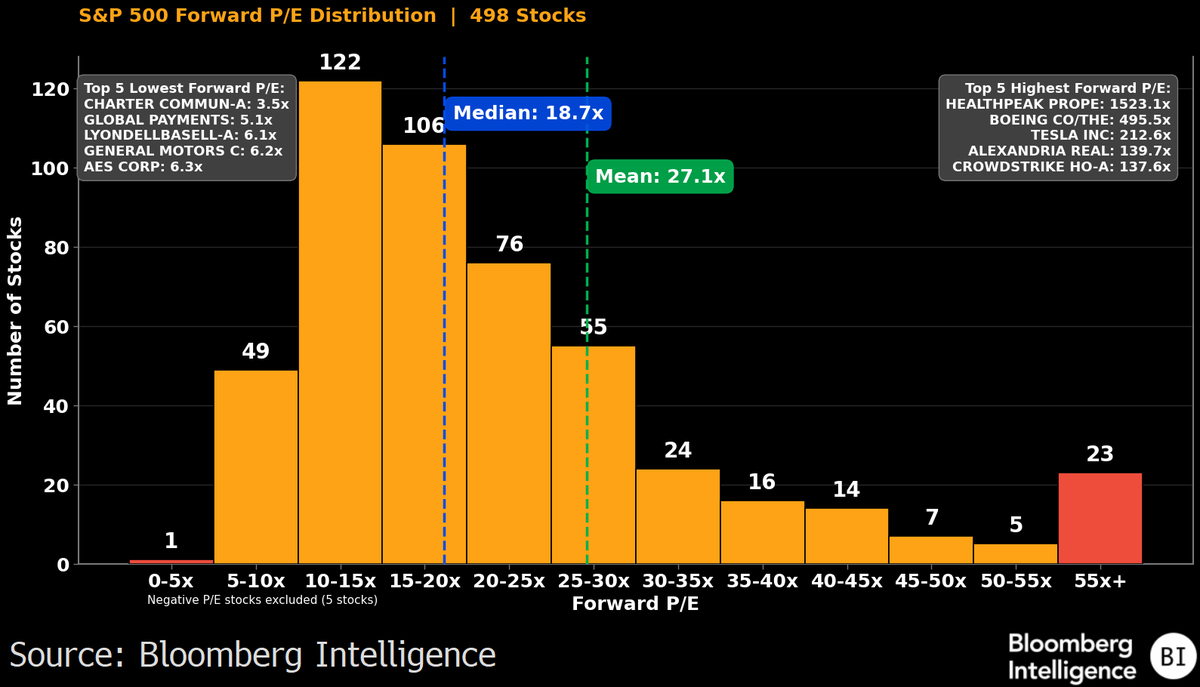
Some S&P 500 valuation charts...
TLDR; SPX valuations aren't as crazy as they look at first glance
Big diff between market cap weighted and equal weight valuations (forward P/E). Ratio close to highest in this data. EW valuations are right around medians (compared to itself)
Forward ROE at highest in this data (since 2006). Somewhat justifies valuations. Of the 244 months in our sample, 45 exhibited higher valuations, but those periods had a median forward ROE of just 18.3%, or 290 bps lower.
Same deal with margins. Forward profit margins highest since 2000. 67 months in our 316-month sample traded at higher valuations. However, those periods carried a median forward margin of just 12%, 340 bps below today.
Value Factor valuation ratio, aka the ratio between the cheapest and the more expensive stocks, remains below averages. Cheap quintile in SPX trades around 13% the valuations of expensive.