Smri

1.1K posts

Smri banner
Smri

Smri

@CryptoSmri

Crypto Trader | Sharing trades | Not Financial Advice | $SOL

Charts انضم Aralık 2024
106 يتبع122 المتابعون
Smri
Smri@CryptoSmri·
@CJ900X I think you’re right again bro
English
0
0
0
11
CJ
CJ@CJ900X·
I have found that when an expanding price leg is unable to trade 25-50% higher than the consolidation it expanded from, it is in range manipulation territory and has the potential to be a false move ... $BTC
CJ tweet media
CJ@CJ900X

Trading Range Manipulation vs. True Range Breakout. Some notes ... TLDR: - If price is unable to break the range manipulation zones, then its likely just that - a move to manipulate above or below the extremes of the range. - Look for reversals at these range manipulation

English
17
5
140
33.2K
Smri
Smri@CryptoSmri·
@CredibleCrypto The Silver chart best represents CRV’s potential
English
7
0
1
80
CrediBULL Crypto
CrediBULL Crypto@CredibleCrypto·
A small sample of what will be included in Part 2 (altcoins) of the vids I am working on right now. The people that are saying $CRV is dead today are the same ones who would have said Silver was "dead" at $4.89 and XRP was "dead" at 50 cents. They would have faded both at high timeframe, macro bottoms, before some of the most aggressive expansion phases we have seen in years on both respective assets. After forming an accumulation base over 4 years in it's own HTF range, $XRP ran 6x to range highs in under a month. $CRV now looks to be wrapping up the final phase of it's own 5.5 year long accumulation base. How long do you think it will take to hit it's own range highs?
CrediBULL Crypto tweet media
English
108
80
854
81.6K
CJ
CJ@CJ900X·
@JCope87 It's a second range and since we spent more time inside (and we are -currently- bound within) it's the most relevant range to price on this timeframe. But the swing at 80.6k is still very relevant.
CJ tweet media
English
3
0
8
423
CJ
CJ@CJ900X·
$BTC Inverse bull market fr
CJ tweet media
English
14
4
120
13.9K
CrediBULL Crypto
CrediBULL Crypto@CredibleCrypto·
Literally the same bottoming formation as silver. Every asset class behaves the same when it comes to market mechanics like accumulation, markup, distribution, etc. It's all the same shit. Some market move faster, some move slower, then there are a number of different accumulation/bottoming patterns, but ultimately- its some period of expansion, consolidation, contraction or contraction, consolidation, expansion. On repeat, cycle after cycle. $CRV
CrediBULL Crypto tweet media
English
79
81
848
105.8K
Smri
Smri@CryptoSmri·
happy new year lol i’m late to a bullish year 🍹
English
0
0
0
12
CrediBULL Crypto
CrediBULL Crypto@CredibleCrypto·
"Better have those .35 bids set if you're looking to add here- not sure how long we will last at these levels. Point of maximum opportunity is a couple of candles away imo." .35, HTF demand, and macro range lows finally tagged. Shared the long entry I took here publicly a few days ago, now we just let it ride. First target is $1.60+ for a clean 5x to start. $CRV
CrediBULL Crypto tweet media
CrediBULL Crypto@CredibleCrypto

Almost to the target mentioned a few days ago as $BTC breaks below 100k. Exactly as expected. Better have those .35 bids set if you're looking to add here- not sure how long we will last at these levels. Point of maximum opportunity is a couple of candles away imo. $CRV

English
80
62
651
95.1K
Smri
Smri@CryptoSmri·
Game right here if you want to make it Say what you want
CrediBULL Crypto@CredibleCrypto

As one of the biggest Bitcoin bulls from 3k $BTC in 2017 till now, it is super important to take the time to really UNDERSTAND the implications of the chart below. Top half is XRP/BTC and the bottom half is BTC. Before we jump into the chart- let's set the stage with a bit of background: As I've said since 2018, Bitcoin is always the first to lead out of bear markets into a new bull run and alts always lag initially and then pick up steam towards the end of the cycle with their biggest moves post BTC cycle top (this is when we see the greatest amount of profit taking on $BTC, and hundreds of billions of dollars of outflow into alts combined with new inflow from a euphoric and greedy retail cohort). At 3k, Bitcoin was a great buy, at 15k Bitcoin was a great buy, at 30k Bitcoin was still a solid buy, and I was staunchly bullish every single time we had reached any of those regions. However, after finally cracking 100k+, and despite my belief that we still have higher to go for Bitcoin in this cycle, the reality is that R/R and expected ROI from current levels does not favor buying $BTC over alts at these levels if you plan to take profits by the end of the current cycle (assumption here is the cycle will end somewhere between now and 300k BTC AND that you are buying alts with real utility, that are down 90+% from their highs, and that have favorable HTF chart structures). There is one caveat- if you are a professional trader and the best trader on earth, then you may be able to perfectly time a rotation from Bitcoin to alts at the exact moment that ALT/BTC pairings are at their pico bottom- for 99% of you (including myself) this is not realistically achievable most of the time- and so- the only other option is to begin to DCA into select, high conviction alts, when you deem them to be at a relatively good R/R zone. Now that we have got that out of the way, let's take a look at the chart. I will again emphasize it is VITAL to understand the point being made here, and it may seem a bit complex to grasp initially- so stay with me and re-read this as many times as you need to until it clicks... The upper portion of the chart is XRP/BTC and the lower portion is $BTC. What I want you to focus on here is the current XRP/BTC ratio of .0000212 that we are now trading at. In simple terms, if you bought $XRP at any time in the past when the XRP/BTC ratio was BELOW this point, then you have outperformed against $BTC from that point until now. To make this easier to visualize, I've highlighted this portion of time in BLUE on the XRP/BTC chart. You'll notice that during this entire time, XRP was underperforming against $BTC (signaled by XRP/BTC bleeding lower for most of this period). For over 460 days, $XRP underperformed, and sentiment here on socials mirrored that- with anyone choosing to buy $XRP over $BTC being mocked, called "crazy", "stupid", "delusional" and the like. And then, in a matter of literally 23 DAYS, XRP shot up over 7x, and in 23 days, the 460+ days of underperformance were made IRRELEVANT as the ROI on $XRP was now GREATER than the ROI on $BTC for anyone who purchased $XRP in that 460 day window of relative underperformance we mentioned earlier. To put this in perspective- if you bought $XRP at ANY point in time during that 460 day window, then today, at current prices of XRP and BTC, you will have outperformed ANYONE who bought $BTC ANYWHERE above 25k. Let that sink in. If you bought $XRP as far back as August of '23- over two years ago- and simply held it until expansion, then you outperformed every Bitcoin buyer that bought BTC at 30k, 35k, 40k, 50k, 60k, etc. DESPITE over 450 days of relative underperformance prior to that 23 day expansion. And THIS is why I have been railing on about the same 4-5 alts for years at their HTF, macro lows, because despite their current underperformance (which is expected), unless you are the best trader on earth, you will likely STRUGGLE to position yourself without a DCA approach in these markets- where an alt can be dormant for years and then erase all that bearish PA in 1/20th of the time. 
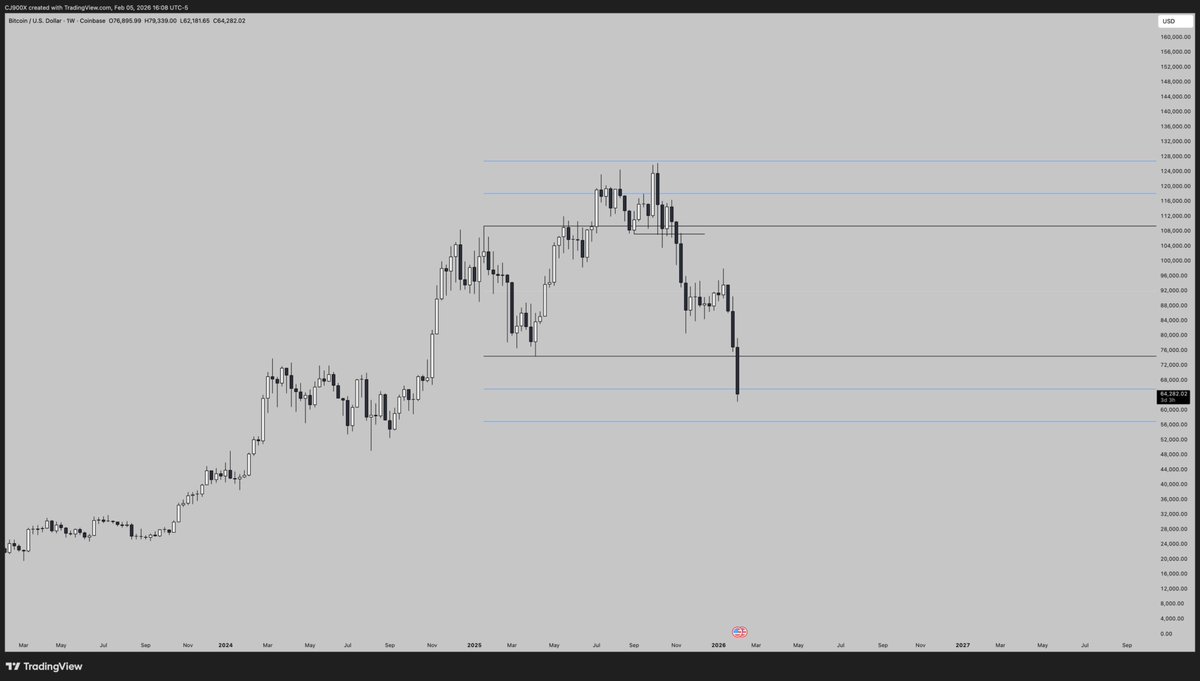
Now consider all of the above, but consider that $BTC now sits at 90k, not 3k, not 15k, and not 30k, but 90k, 30x above the cycle bottom at 3k, and 6x above the more recent 5th wave origin at 15k. 
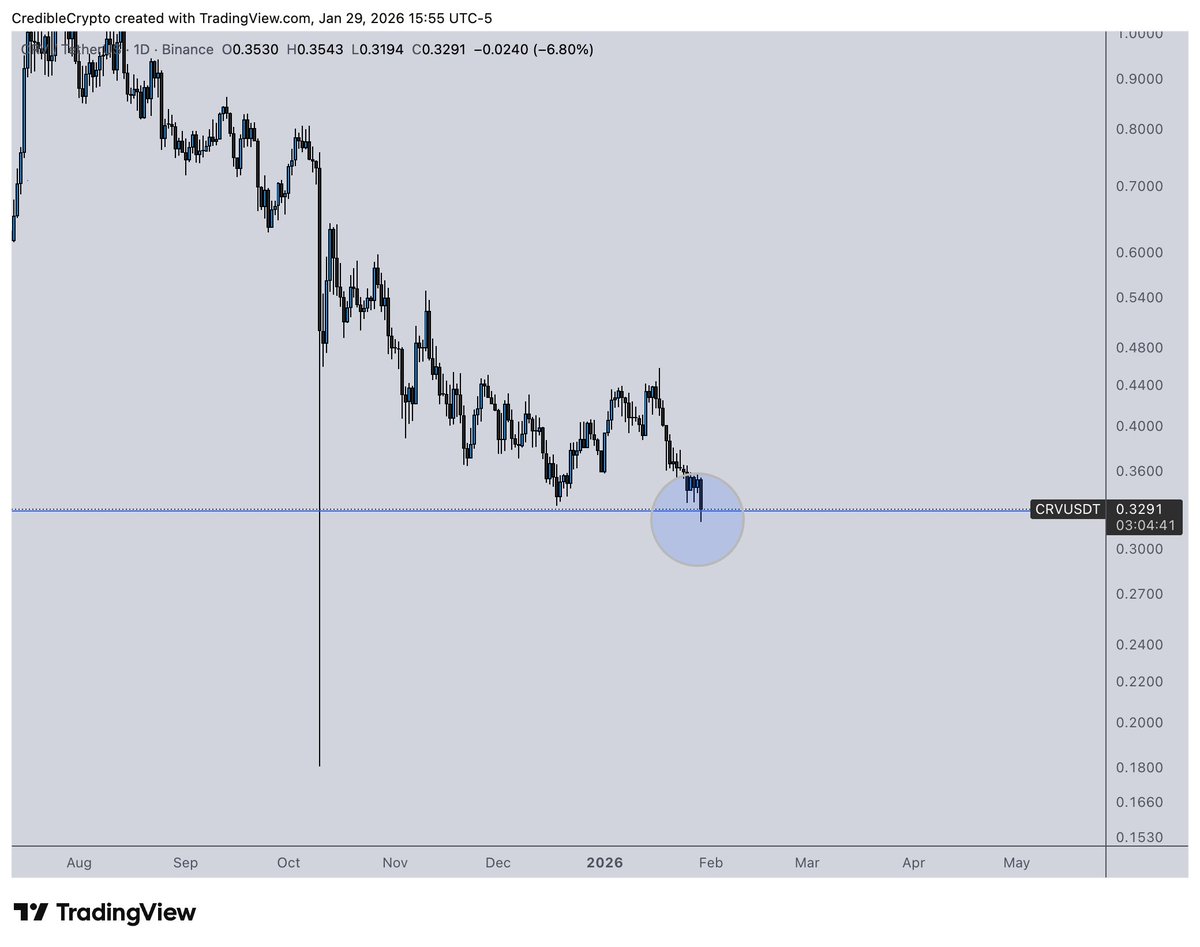
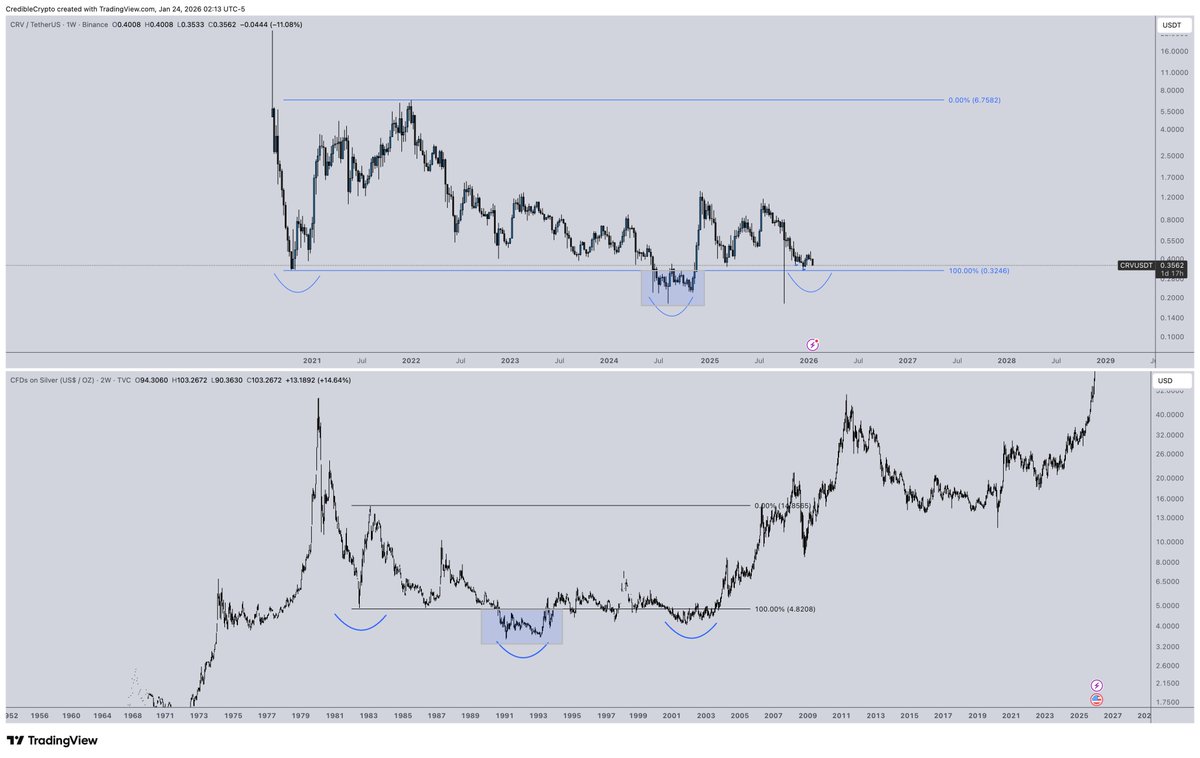
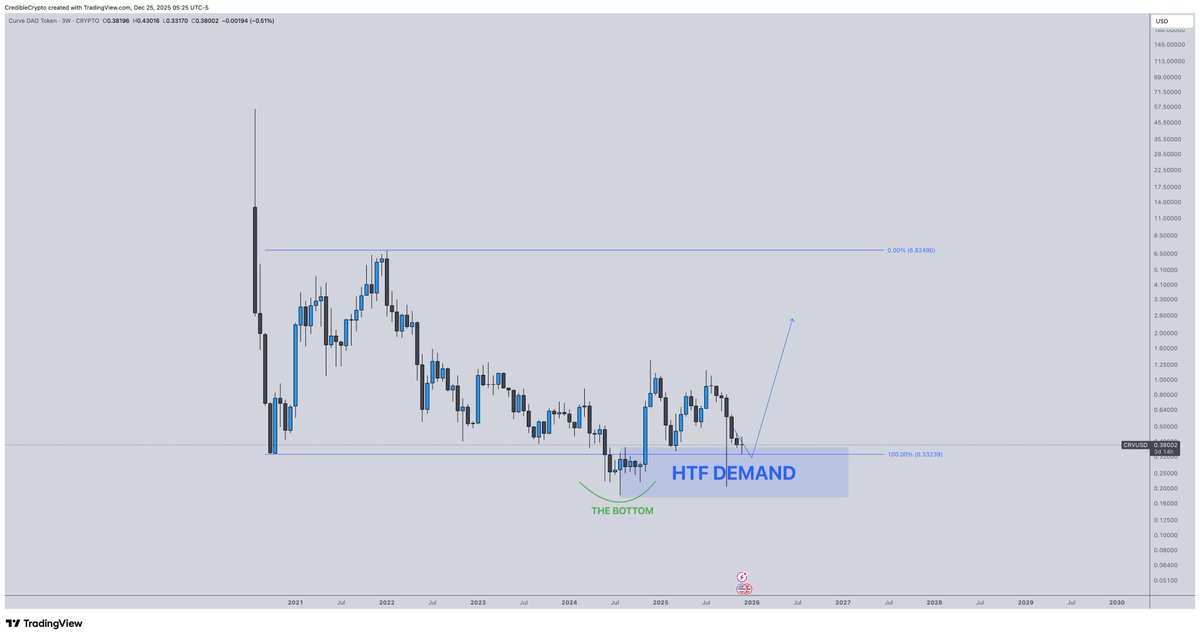
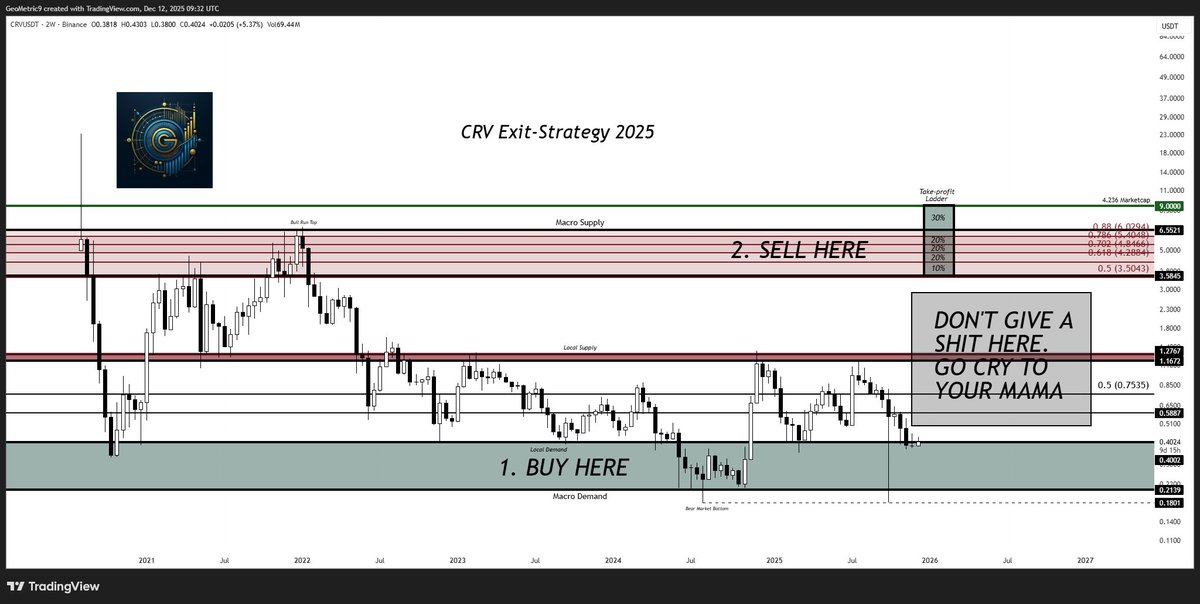
We are now at a place where the R/R on BTC vs (sound) alts is far worse than it was in the example above, especially on coins like $CRV that sit at macro range lows. Let's put prior ATH highs aside for a second and consider that even a 3x on $CRV from current levels- from .35 to $1- is the equivalent of $BTC moving up from current levels to $240,000 in terms of ROI. So, bottom line, people can continue to whine about alts not moving and talking about how it's silly to invest in them, but I will continue to beat the drum on this as long as I need to because in the end its clear to me what's coming, as it was for $XRP and as it will be for many others. We already KNOW $BTC leads out of major corrections- it is not a profound statement to say that "BTC will outperform right now". However, for those that are patient and able to look 10 steps ahead instead of 2, the real opportunity at this point in time is in high quality, fundamentally sound, and structurally solid alts- even if you have to wait for $BTC to top before we see the largest moves on them.

English
1
0
2
24
GeoMetric
GeoMetric@GeoMetric_9·
$CRV for dummies
GeoMetric tweet media
English
32
14
226
26.5K
Smri
Smri@CryptoSmri·
If you havent added to spots, still is a good time Gm
English
1
0
0
14
Smri
Smri@CryptoSmri·
good morning boring price action, just being patient
English
0
0
0
14
Smri
Smri@CryptoSmri·
happy weekend good night
English
0
0
0
12
Popeye
Popeye@SailorManCrypto·
Time for a little exercise. What do we have here? And what would you do trading wise?
Popeye tweet media
English
44
4
77
7.6K
CrediBULL Crypto
CrediBULL Crypto@CredibleCrypto·
Nice to see $TRAC listed on the 2nd largest Korean crypto exchange in the world. "South Korea is the second-largest cryptocurrency market globally, with trading volumes in Korean won (KRW) reaching $663 billion. This positions South Korea just behind the United States, which leads with $832 billion in crypto trading volume." South Koreans can now easily get exposure to @origin_trail 🔥
@

📢 New Listing 🚀 오리진트레일(#TRAC) 원화 마켓 추가 안내 🚀 $TRAC/KRW will be listed on #Bithumb! 🔸 Details : feed.bithumb.com/notice/1650991 #Bithumb #TRAC @origin_trail

English
16
46
396
139K
Smri
Smri@CryptoSmri·
Gm gm
English
0
0
0
17
Smri
Smri@CryptoSmri·
@CJ900X Alright thank you CJ
English
0
0
1
39
CJ
CJ@CJ900X·
Technically a balanced price range is just a block of efficient price action (i.e. all imbalances have been mitigated). But when I use BPR instead of FVG or iFVG I am referring to this specific signature in price, where the inefficient move down is met with an equally inefficient move up. Where as an iFVG you typically see this only on one side. Same same, but different. Example of a Weekly BPR at the 16-20k lows in 2022.
CJ tweet media
English
2
0
9
573
CJ
CJ@CJ900X·
$BTC - H4 The initial long idea from my last post turned out to be THE move for today. I mis-categorised the opportunity (explained in the prior post) and so missed it myself. While I do think the lows into 85k could get run at some point, I now do not think it is the NEXT most likely move. (Need to be careful in trading - that you don't anchor your mind to the move that you wanted the market to make as it only results in a skewed bias and poor decision making. Always try and reset and read what the market DID not what you want it to do). With that minor point above.... I think it's now more likely for a shallow retrace into this H4 balanced price range, paying special attention to the midpoint at 88.6k. IMO price shouldn't really be going below 88.6k before it takes out external range liquidity now. TLDR: - Expecting a shallow retrace into the H4 BPR - Not expecting lower than 88.6k until Range High is taken + Equal Highs at 93-94k Ideally now we get: 1. Shallow retrace into H4 BPR before 93-94k 2. Larger retrace after taking Range High liquidity (its also pmVWAP). Retrace into H4 demand below pmVAL at 86k 3. Larger move up to 100-102k 🍿
CJ tweet mediaCJ tweet media
English
23
12
152
16.6K
Smri
Smri@CryptoSmri·
@CJ900X What do you think of the iFVG?
English
0
0
0
54
CJ
CJ@CJ900X·
If we close a solid H4 candle here (so far looks like we will) IF at any point we put in a re-test of ~ 85k H4 demand (below pmVAL) its an A+ swing long to 100k imo. Just not sure we are given that opportunity, but its worth chalking up for later. $BTC
CJ tweet media
English
3
2
66
5.5K
CJ
CJ@CJ900X·
$BTC Ideally we see something like this play out. Another push higher to engineer liquidity below the local lows, then later run them into untapped demand before higher. The long into local demand is a bit risky, might sit that one out. I'm more so looking for the intraweek swing long should we get this type of structure. Also gm
CJ tweet media
English
31
20
215
26.5K