تغريدة مثبتة

𝐉𝐂𝐒 𝐃𝐀𝐗 𝐒𝐖𝐈𝐍𝐆 𝐏𝐄𝐑𝐅𝐎𝐑𝐌𝐀𝐍𝐂𝐄 📊🔥
JCS-Charting DAX swing trades:
Feb: +10,336 pts ✅
Mar: +5,897 pts ✅
Apr (so far): +3,580 pts 🚀
Consistency is the edge. More to come. 🧠
#DAX40 #FinTwit #SwingTrading #TradingResults #JCSCharting

English
JCS-Charting
9.6K posts

@JoeChartingStar
📊 Master the markets with expert insights 📈 DAX, S&P 500, Nasdaq, Gold, BTC & more ⚠️ No trading advice — full transparency 👉 Join Discord: https://t.co/25klc5qMQ2
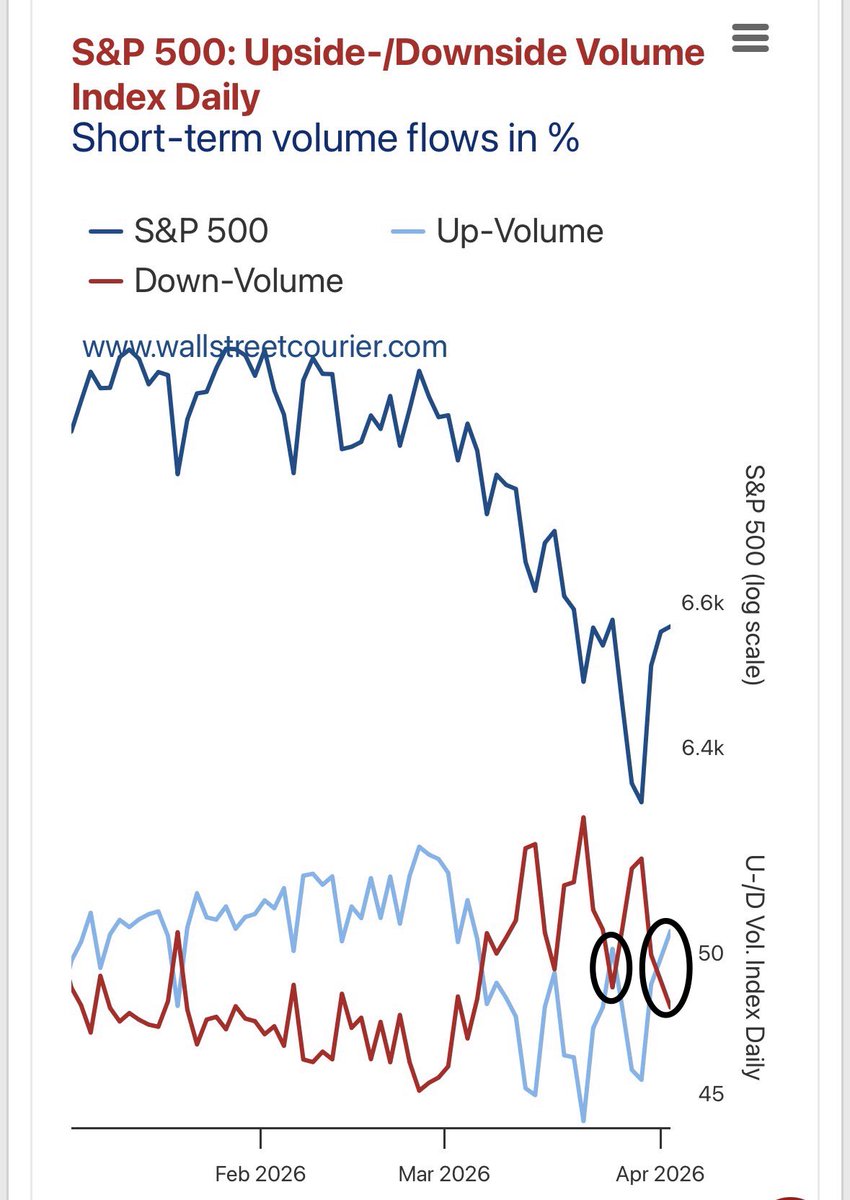
𝐕𝐎𝐋𝐔𝐌𝐄 𝐒𝐖𝐈𝐓𝐂𝐇 👀📊 Up-volume flipped higher this week after weeks of downside-volume dominance. ✅ That’s often the first tell before price catches up. 🧠📈 Dead cat bounce only or is it more?
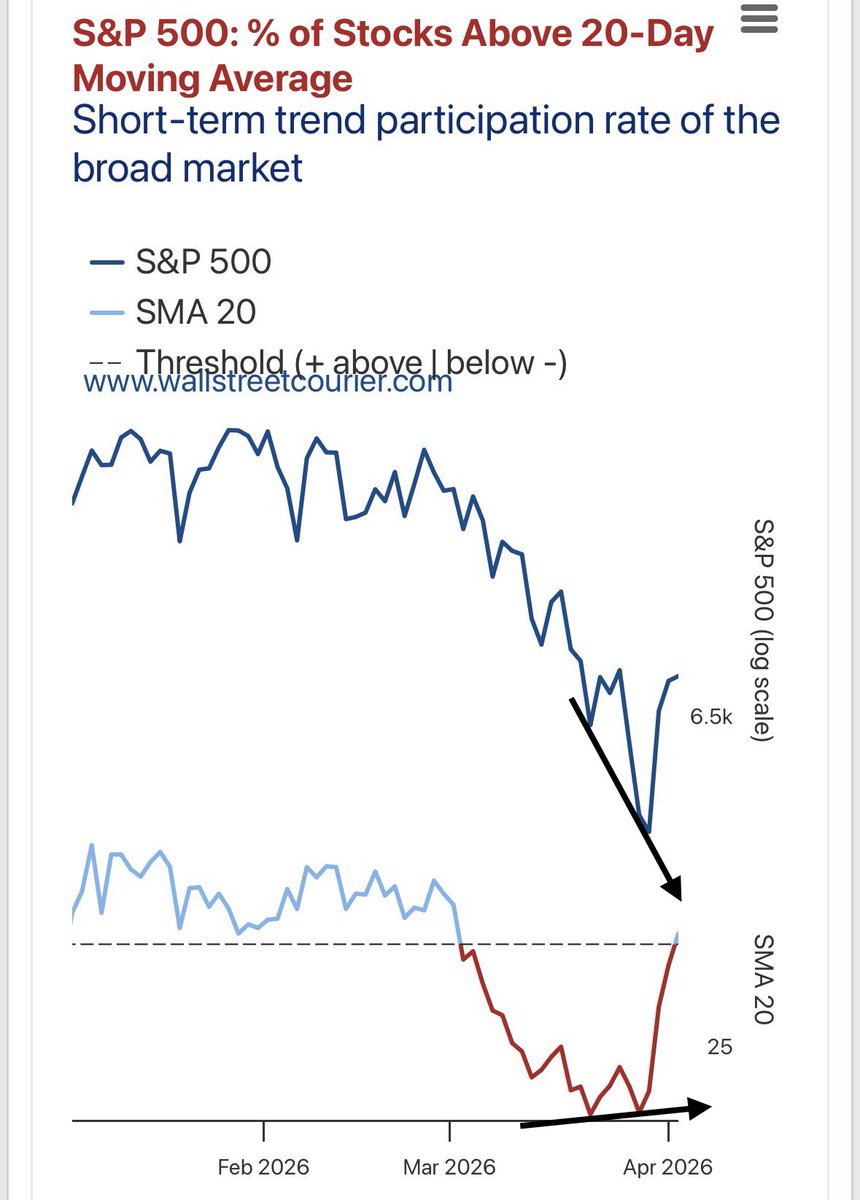
$NYSE & $SPX 𝐁𝐑𝐄𝐀𝐃𝐓𝐇 𝐖𝐀𝐑𝐍𝐈𝐍𝐆 ⚠️🚀 $NYMO (McClellan Oscillator) is flashing a double positive divergence. 🧠📈 SP500 made two lower lows… but #NYMO made higher lows. ✅ When this unfolds, the upside reaction can be violent. 🚀🔥 Feels like we’re very close to a temporary bottom here. #SP500 #FinTwit #MarketBreadth #Trading #JCSCharting
@JoeChartingStar I will be honest here - I have never seen anyone in real life or social media, who is so consistently correct as you are. People can have different opinions and different methods of trading. But at the end, its only the results that matter.

@JoeChartingStar @WallStCourier there is no bottom in sight. idk where you got that information from.


𝐂𝐎𝐍𝐒𝐈𝐒𝐓𝐄𝐍𝐂𝐘 ✅😍 Happy members + consistent execution = happy me too. 🎯🧠 That’s the whole game. #FinTwit #Trading #JCSCharting


𝐒𝐏𝐘 𝐇𝟏 𝐈𝐒𝐇𝐒 𝐖𝐀𝐓𝐂𝐇 👀📈 $SPY H1 Potential iSHS setup — but it needs one more touch of the falling neckline to trigger. 🎯 Trigger area: 657.68 ✅ If it activates & breaks the neckline, targets are already mapped in the chart. 🚀 JCS-Charting = precise calculations, not guessing. 🧠 #SPY #SP500 #FinTwit #TechnicalAnalysis #JCSCharting


𝐒𝐏𝐘 𝐇𝟏 𝐈𝐒𝐇𝐒 𝐖𝐀𝐓𝐂𝐇 👀📈 $SPY H1 Potential iSHS setup — but it needs one more touch of the falling neckline to trigger. 🎯 Trigger area: 657.68 ✅ If it activates & breaks the neckline, targets are already mapped in the chart. 🚀 JCS-Charting = precise calculations, not guessing. 🧠 #SPY #SP500 #FinTwit #TechnicalAnalysis #JCSCharting


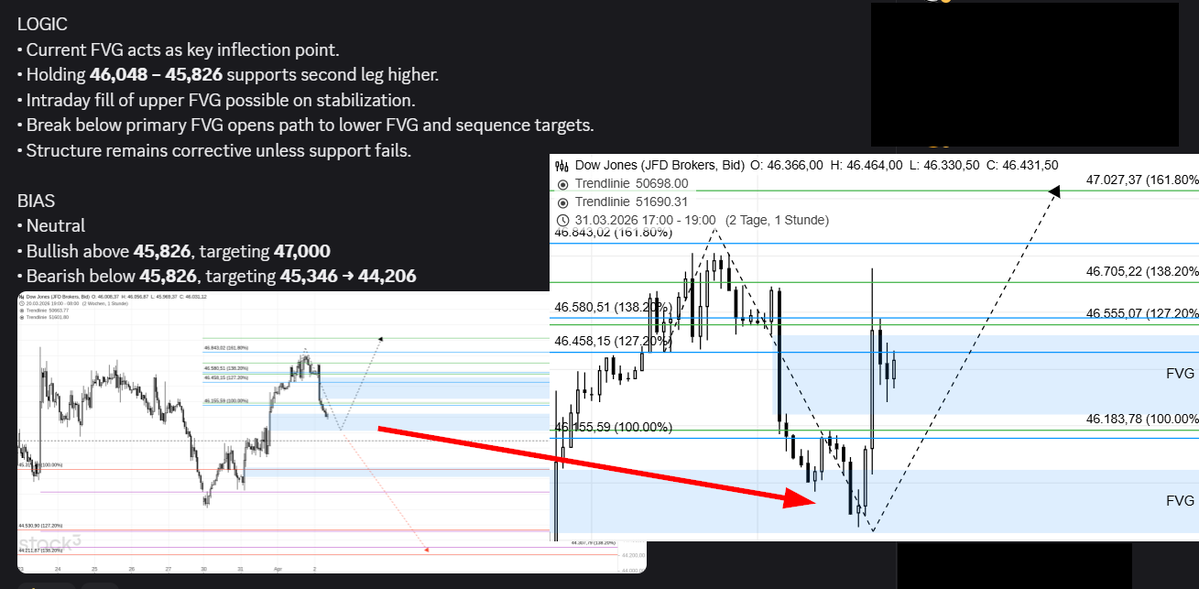
$SPY produced a bearish 5-wave decline from the highs. That structure DEMANDS another leg lower. We've now retraced ~30% of the overall decline and are inside Daily FVG resistance at 6454–6568. Expect price to cross the 2/4 trendline near 6550 — then the next wave down toward 6178 sets up. This rally will get sold HARD. $SPX should not close above 6568. Warnings were sent.
𝐒𝐏𝐘 𝐇𝟏 𝐈𝐒𝐇𝐒 𝐖𝐀𝐓𝐂𝐇 👀📈 $SPY H1 Potential iSHS setup — but it needs one more touch of the falling neckline to trigger. 🎯 Trigger area: 657.68 ✅ If it activates & breaks the neckline, targets are already mapped in the chart. 🚀 JCS-Charting = precise calculations, not guessing. 🧠 #SPY #SP500 #FinTwit #TechnicalAnalysis #JCSCharting


𝐃𝐀𝐗 𝐇𝟒 𝐑𝐄𝐕𝐄𝐑𝐒𝐀𝐋 𝐙𝐎𝐍𝐄 👀🎯 $DAX H4 Tagged the 50% RT and started showing reversal signs. ✅ Key now: 22,700 must hold on the H4 close 🛡️ Hold it → green zone can complete / fill. 📈 Lose it → deeper reset risk. ⚠️📉 #DAX40 #FinTwit #TechnicalAnalysis #Trading #JCSCharting