Sal Goodarzi@tidalmacro
The Synthetic Melt-Up: How Stock Replacement and Volatility Suppression Continues to Engineer This "Crack-Up Boom", and Why Legacy Macro Is Completely Broken
TL;DR: The historic divergence between deteriorating macro indicators and a vertical stock market is not a symptom of retail euphoria, but a fundamental redesign of institutional risk architecture that explains why equities are ripping while traditional havens like Gold and Bitcoin stall. Faced with an inability to price terminal corporate value due to shifting trade policies and the AI revolution, asset managers have abandoned traditional spot equity and bypassed hard assets that lack highly liquid derivatives plumbing. Instead, they are executing a stock replacement strategy, parking an unprecedented $8.2 trillion into high-yielding Money Market Funds while risking only that generated interest on short-dated, high-delta call options. This structural shift has hollowed out the demand for traditional index puts, turning classic complacency metrics into phantom signals. However, this volatility-suppressed loop faces an unyielding timeline: when data-driven clarity returns via the rigid corporate earnings calendar in late July, extending into August for Nvidia, the wide distribution of potential future states will collapse, exposing options dealers to severe gap-down risk (if earnings disappoint) and triggering a violent, asymmetric volatility reset, as well as wealth destruction.
* * *
1. The Broken Macro Mirror and Policy Alchemy
Traditional macro analysts are struggling to reconcile a vertical S&P 500 with a landscape dominated by global trade frictions, changing international orders, and an accelerating fiscal debt spiral. This massive divergence often leads to the conclusion that the entire system is being directly manipulated from above. In reality, policy controllers are not orchestrating the geopolitical events themselves because the sheer amount of real-world entropy makes perfect orchestration impossible. Instead, the strategic manipulation occurs entirely within the policy responses and the structural options market plumbing. When a major macro shock occurs, it provides immediate political cover for the U.S. Treasury or the Federal Reserve to deploy targeted liquidity injections. By the time a disruptive trade policy or tariff is officially enacted, its specific parameters have already been systematically leaked and priced into the volatility landscape, producing a market reaction that completely evades a mechanical crash.
2. The Sovereign Plumbing and the Reserve Floor
This coordinated defense between the Treasury and the Fed is the core reason why classic liquidity metrics failed to project the current rally. Legacy financial models predicted that historic fiscal deficit spending would choke the banking system by draining essential settlement reserves. To prevent this, the Treasury has deployed an aggressive, structural buyback program, actively purchasing older, less liquid, off-the-run long-duration bonds in the secondary market and funding those operations by issuing highly liquid short-term Treasury bills (which will only explode higher with stable coins). This operation successfully replaces dead-weight collateral with high-velocity instruments. Simultaneously, the Federal Reserve has adjusted its open-market framework to maintain an ample reserves regime by buying short-dated bills, keeping a firm floor under bank liquidity and keeping the institutional repo market fully insulated from sudden clearing spikes.
3. Trading the Path over the Destination
While sovereign plumbing prevents a mechanical collapse, the actual driving force behind the equity melt-up is a structural migration of capital within the options market. Because institutional asset managers are facing massive structural uncertainties, traditional discounted cash flow modeling has suffered a terminal breakdown. When market participants cannot calculate a reliable terminal value a few years down the line, they lose the ability to trade the delta, which represents the directional destination of the asset. Faced with this fundamental blindness, institutional desks have pivoted entirely from investing to volatility management, adopting a stock replacement strategy to express their bullish exposure through defined-risk long call options rather than purchasing physical spot shares. Because a long call option caps an investor's maximum loss strictly to the premium paid, downside protection is automatically engineered into the trade from inception; hence the current extreme low values in Left Tail Index, or Put/Call ratio, for example.
4. Deconstructing the False Complacency
This rapid transition to synthetic equity exposure perfectly explains the collapse of traditional risk metrics highlighted by many market observers. When analysts point to a plunging Put/Call ratio as a sign of blind, unhedged market euphoria, they could be missing the structural reality beneath the surface. The ratio is falling because of a severe starvation of the numerator alongside a massive explosion in the denominator. Institutional managers who use stock replacement do not own physical spot shares, meaning they have no mechanical requirement to buy downside put protection, while their relentless demand for synthetic long calls drives the denominator to record highs.
The same mechanical distortion applies to more other indicators, too. Implied correlation is cratering because capital is likely heavily concentrated in single-name call options on a handful of mega-cap winners, decoupling individual stock variance from the broad index. Left-tail volatility is disappearing because deep out-of-the-money index puts are obsolete when the baseline downside risk is already capped by the call premium.
5. The Money Market Paradox
This framework elegantly, in my opinion, resolves the ultimate paradox of the current cycle, which is the simultaneous vertical climb of both equity indexes and Money Market Fund cash levels. FRED data shows that money market balances at an unprecedented $8.2 trillion, which might initially look like proof that investors are 'not' fleeing currency debasement. However, in a financialized sovereign debt spiral, the government actively pays investors to hoard cash by keeping short-term interest rates high. Institutional desks are 'optimization-renting' this environment, parking, say, 95% of their core principal safely in money market funds to clip a risk-free 5% yield, and deploying only the generated yield to purchase the high-delta call options fueling the stock market.
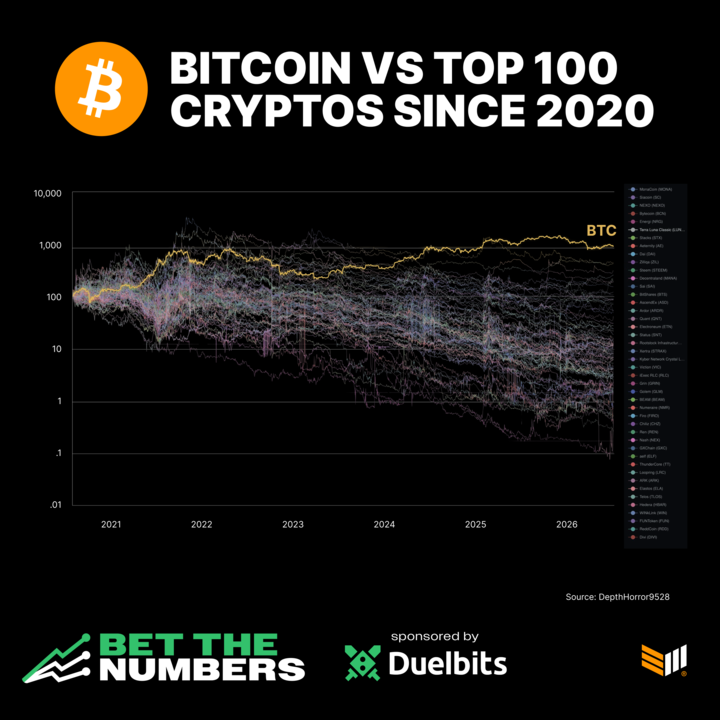
This dynamic explains why equities continue to rip while traditional hard assets like Gold and Bitcoin have faced sharp tactical corrections from their respective peaks, with Gold pulling back to around $4.5k an ounce and Bitcoin trading around the $70k level. Crucially, the institutional stock replacement strategy cannot be replicated in alternative assets because Gold and Bitcoin lack the deeply liquid, institutional-grade options markets that equities possess. Without that hyper-liquid derivatives infrastructure, macro desks cannot efficiently execute the ninety-five to five cash and call split to safely harvest upside convexity. Consequently, holding non-yielding physical gold or spot Bitcoin introduces an immense opportunity cost when cash pays a guaranteed 5%. Furthermore, mega-cap corporations act as dynamic inflation hedges because their monopoly pricing power allows them to immediately adjust enterprise fees to match currency expansion, whereas hard assets must absorb raw, unhedged capital flows without the assistance of a deep equity dealer options network that mechanically buffers volatility by buying every market dip.
6. Mechanics of Wealth Destruction in a Vol Reset
Because risk can never be fully deleted, only redistributed, this stock replacement regime sets up a highly concentrated profile of financial vulnerability for the moment the machine breaks. When the market eventually turns, the wealth destruction will be massive, falling heavily onto options dealers who face severe overnight gap risk. To hedge the calls they sell to institutions, dealers must dynamically purchase underlying spot shares. If an unexpected macro shock causes the market to gap down violently, dealers cannot unwind their massive spot inventory fast enough in an illiquid market (with no spot demand or put support), forcing them to absorb catastrophic execution losses.
At the same time, institutional call buyers will watch their active options premiums vaporize to zero in a matter of days, erasing hundreds of billions of dollars in fund performance even though their core principal remains insulated in money market funds. The ultimate casualties will be the passive, legacy spot holders, including pension funds, retirement systems, and standard index-tracking exchange-traded funds. These entities are bound by strict mandates that force them to hold physical spot equity at all times, meaning they will absorb the full weight of the nominal dollar destruction when dealers dump spot shares to unwind their books.
7. The July Valuation Wall and the End of Ambiguity
The structural volatility suppression engineered by this options loop requires a perpetual state of unresolved, high-variance anxiety to sustain its profitable feedback loop, meaning that the ultimate party crasher to this melt-up, somewhat ironically, could be data-driven 'clarity'. While global trade negotiations and geopolitical conflicts can be prolonged indefinitely by strategic political actors, the corporate capital cycle is bound by an unyielding calendar that forces public tech monopolies to report hard numbers every ninety days. This upcoming corporate reporting sequence represents the first major valuation wall where speculative capital expenditure must answer to realized return on invested capital.
Alphabet kicks off the sequence on July 23, serving as the initial indicator of whether massive infrastructure outlays are actively eroding cloud margins. Microsoft and Meta follow on July 29, testing enterprise software monetization and digital ad margin durability. Apple and Amazon report on July 30, revealing consumer-side hardware upgrades and cloud infrastructure efficiency. Finally, Nvidia anchors the cycle on August 26, establishing whether physical architecture demand can maintain its historic structural premium.
If these prints reveal a distinct plateauing of the artificial intelligence monetization curve, the terminal value calculations will suddenly hit a rigid mathematical ceiling. This sudden return of clarity will cause the wide distribution of potential future states to collapse, instantly dissolving the implied volatility skew, crushing the dealer gamma walls, and forcing a violent transition to a short-gamma liquidation regime.
* * *